[1]:
library(Seurat)
library(dplyr)
library(tidyverse)
library(viridis)
library(ggalluvial)
library("ggsci")
library("ggplot2")
library("gridExtra")
Attaching SeuratObject


Attaching package: ‘dplyr’


The following objects are masked from ‘package:stats’:

    filter, lag


The following objects are masked from ‘package:base’:

    intersect, setdiff, setequal, union


Registered S3 method overwritten by 'cli':
  method     from
  print.boxx spatstat.geom

── Attaching packages ─────────────────────────────────────── tidyverse 1.3.1 ──

✔ ggplot2 3.3.5     ✔ purrr   0.3.4
✔ tibble  3.1.6     ✔ stringr 1.4.0
✔ tidyr   1.1.4     ✔ forcats 0.5.1
✔ readr   2.1.1

── Conflicts ────────────────────────────────────────── tidyverse_conflicts() ──
✖ dplyr::filter() masks stats::filter()
✖ dplyr::lag()    masks stats::lag()

Loading required package: viridisLite


Attaching package: ‘gridExtra’


The following object is masked from ‘package:dplyr’:

    combine
DC clusters#
[2]:
my24_1colors <- c('#53868B','#00F5FF','#7FFFD4','#C1FFC1','#0000FF','#7B68EE',
                  '#CDCD00','#FFF68F','#CD9B1D','#8B658B','#FF6A6A','#8B3A3A',
                  '#1E90FF','#FF69B4','#8DB6CD','#CAE1FF','#EECFA1','#8B7B8B',
                  '#4F4F4F','#FF4500','#BC8F8F','#FFA500','#228B22','#8B4513')

my23colors <- c('#53868B','#00F5FF','#C1FFC1','#0000FF','#7B68EE',
                  '#CDCD00','#FFF68F','#CD9B1D','#8B658B','#FF6A6A','#8B3A3A',
                  '#1E90FF','#FF69B4','#8DB6CD','#CAE1FF','#EECFA1','#8B7B8B',
                  '#4F4F4F','#FF4500','#BC8F8F','#FFA500','#228B22','#8B4513')
[3]:
setwd("/annoroad/data1/bioinfo/PROJECT/big_Commercial/Cooperation/B_TET/B_TET-003/std/result/fanxuning/commander_test/THU")
[4]:
DC <- readRDS("V1_Celltype_allDC_2nd_withAnnotation.rds")
[5]:
DC@meta.data$cell.type.sub3 <- "LAMP3+ DC"
DC@meta.data[DC@meta.data$cell.type.sub2 == "DC – CD1C+CLEC10A+", "cell.type.sub3"] <- "CD1c+ DC"
DC@meta.data[DC@meta.data$cell.type.sub2 == "DC – CD207+CD1E+", "cell.type.sub3"] <- "Langerin+ DC"
DC@meta.data[DC@meta.data$cell.type.sub2 == "DC – CLEC9A+WDFY4+", "cell.type.sub3"] <- "CD141+ DC"
DC@meta.data[DC@meta.data$cell.type.sub2 == "pDC – TCF4+IL3RA+", "cell.type.sub3"] <- "pDC"

DC@meta.data$cell.type.sub3 <- factor(DC@meta.data$cell.type.sub3,
                                      levels = c("CD141+ DC", "CD1c+ DC", "Langerin+ DC", "LAMP3+ DC", "pDC"))
#scale_color_simpsons
[6]:
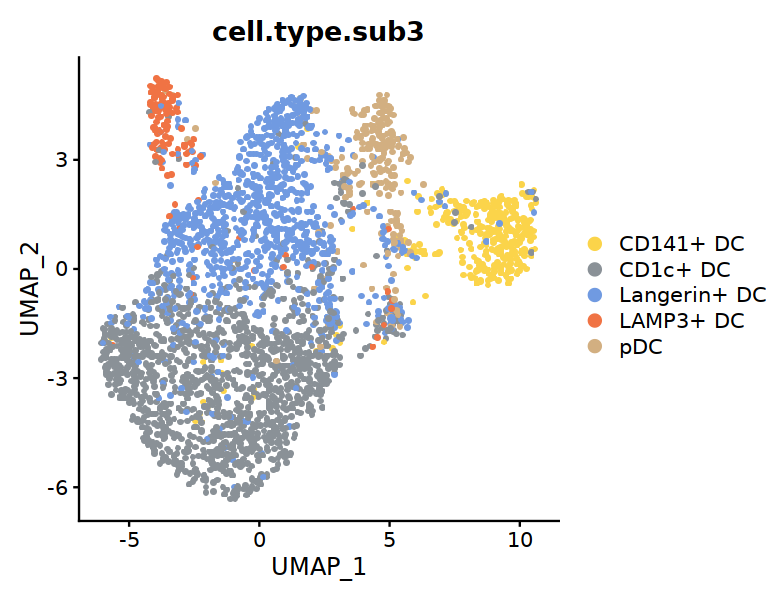
options(repr.plot.width=6.5, repr.plot.height=5)
DC_colors <- c("#FBD44A", "#8A9197", "#709AE1", "#F07344", "#D2AF81")
DimPlot(DC,  group.by="cell.type.sub3", raster=TRUE, cols=DC_colors,
        label=FALSE,pt.size=3)

#ggsave("Fig2A-DC-clusters.pdf",w=6.5,h=5)
[6]:
DC@meta.data$status2 <- "Malignant"
DC@meta.data[DC@meta.data$status == "P", "status2"] <- "Non-Malignant"
DC@meta.data[DC@meta.data$status == "T", "status2"] <- "Malignant"

DC@meta.data$status2 <- factor(DC@meta.data$status2,levels = c("Malignant", "Non-Malignant"))
#
[8]:
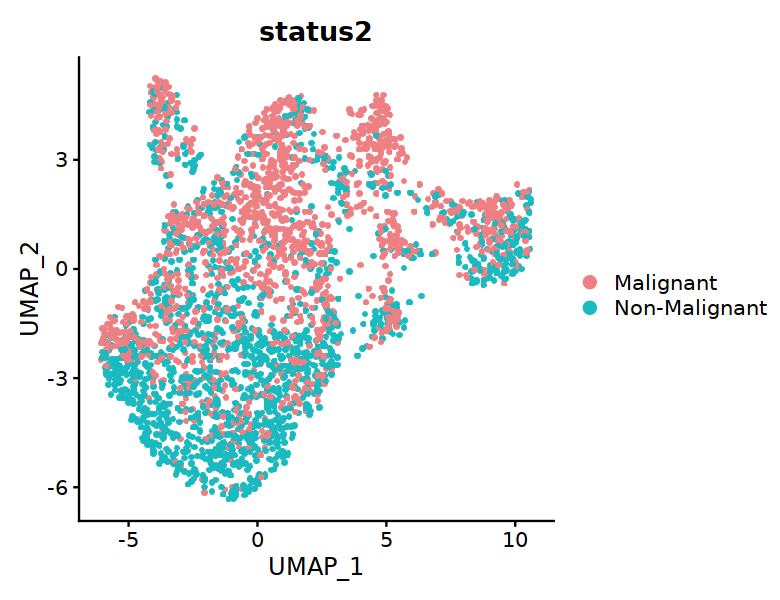
options(repr.plot.width=6.5, repr.plot.height=5)

DimPlot(DC,  group.by="status2", raster=TRUE, cols=c('#EE8084','#19BBC1'), label=FALSE,pt.size=3)
#ggsave("Fig2C-DC-condition.pdf",w=6.5,h=5)
[9]:
unique(DC@meta.data$patient)
- MIBC5
- MIBC6
- MIBC7
- MIBC8
- MIBC9
- MIBC10
- MIBC11
- MIBC12
- MIBC13
- MIBC14
- MIBC15
- MIBC16
Levels:
- 'MIBC5'
- 'MIBC6'
- 'MIBC7'
- 'MIBC8'
- 'MIBC9'
- 'MIBC10'
- 'MIBC11'
- 'MIBC12'
- 'MIBC13'
- 'MIBC14'
- 'MIBC15'
- 'MIBC16'
[10]:
DC@meta.data$treat <- "NoTreat"
DC@meta.data[DC@meta.data$patient == "MIBC5", "treat"] <- "Treat"
DC@meta.data[DC@meta.data$patient == "MIBC6", "treat"] <- "Treat"
DC@meta.data[DC@meta.data$patient == "MIBC8", "treat"] <- "Treat"
DC@meta.data[DC@meta.data$patient == "MIBC13", "treat"] <- "Treat"
[ ]:
[11]:
options(repr.plot.width=5, repr.plot.height=4)
Idents(DC) <- "cell.type.sub3"

subDC22 <- subset(DC, cell.type.sub3 != "pDC")

VlnPlot(subDC22, features=c("CD274"), split.by="treat",
            cols = c('#EE8084','#19BBC1'), assay="RNA", slot="data",
            pt.size = 0) +
        theme(axis.ticks.x=element_blank()) +
        theme(axis.text.y=element_text(angle=0,hjust=1,size=12))
Error in theme(axis.ticks.x = element_blank()): 没有"theme"这个函数
Traceback:
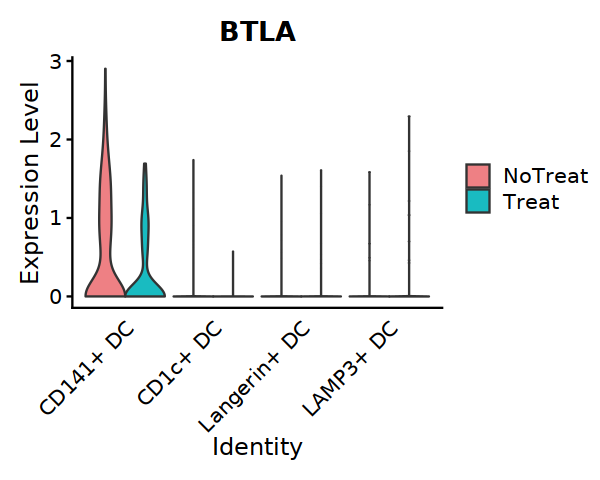
[20]:
VlnPlot(subDC22, features=c("BTLA"), split.by="treat",
            cols = c('#EE8084','#19BBC1'), assay="RNA", slot="data",
            pt.size = 0) +
        theme(axis.ticks.x=element_blank()) +
        theme(axis.text.y=element_text(angle=0,hjust=1,size=12))
[ ]:
[ ]:
[ ]:
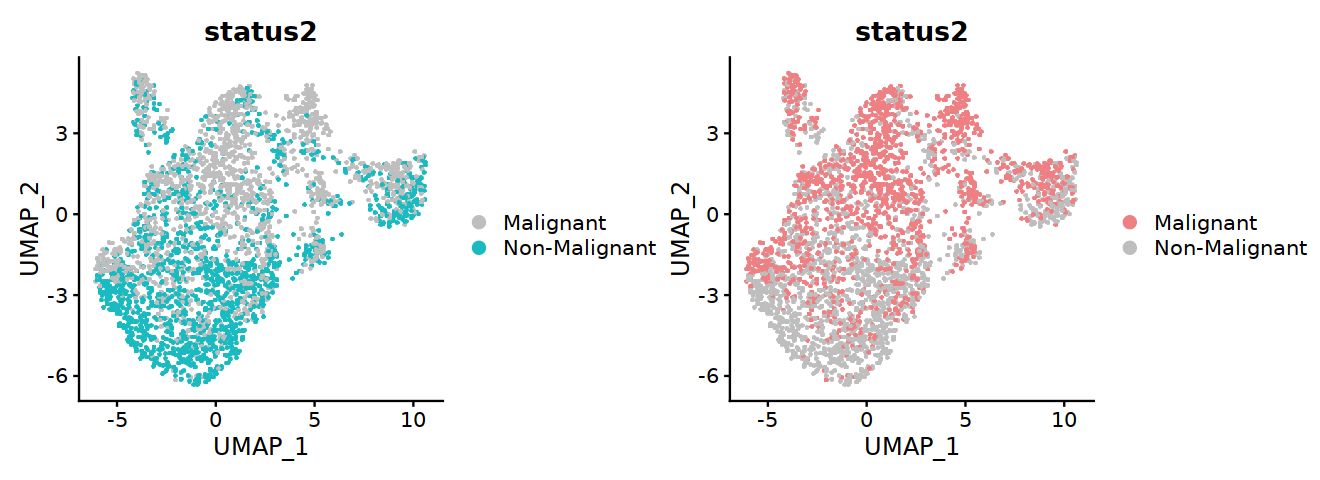
[13]:
options(repr.plot.width=11, repr.plot.height=4)

p1 <- DimPlot(DC,  group.by="status2", raster=TRUE, cols=c('grey','#19BBC1'), label=FALSE,pt.size=3)

p2 <- DimPlot(DC,  group.by="status2", raster=TRUE, cols=c('#EE8084','grey'), label=FALSE,pt.size=3)

p1+p2

#ggsave("Fig2C-DC-condition-two.pdf", w=11, h=4)
[4]:
print(1)
[1] 1
[ ]:
str(DC)
[11]:
options(repr.plot.width=5, repr.plot.height=5)

DC_per <- round(prop.table(table(DC@meta.data[,c("status2", "treat")]), margin=1),3)
DC_per <- data.frame(DC_per)
DC_per$status2 <- factor(DC_per$status2,levels = c("Non-Malignant", "Malignant"))

#plot_sank(DC_per, "status2", "treat","Freq", DC_colors)
[ ]:
[ ]:
[ ]:
[12]:
plot_sank <- function(dada_per, condition, groups, count, colors){
    p <- ggplot(dada_per,
       aes_string(x = condition, stratum = groups, alluvium = groups, y=count,
           fill = groups, label = groups)) +
      scale_x_discrete(expand = c(0, 0)) +
      geom_flow(width = 1/8) + #线跟方块间空隙的宽窄
      geom_stratum(alpha = .9,width = 1/10) + #方块的透明度、宽度
      #geom_text(stat = "stratum", size = 3, color="black") +  #文字大小、颜色
      scale_fill_manual(values = colors) +

      xlab("") + ylab("") +
      theme_bw() + #去除背景色
      theme(panel.grid =element_blank()) + #去除网格线
      theme(panel.border = element_blank()) + #去除外层边框
      theme(legend.title = element_blank()) +
      theme(axis.line = element_blank(),axis.ticks = element_blank()) + #去掉坐标轴
      ggtitle("")
    return(p)
}
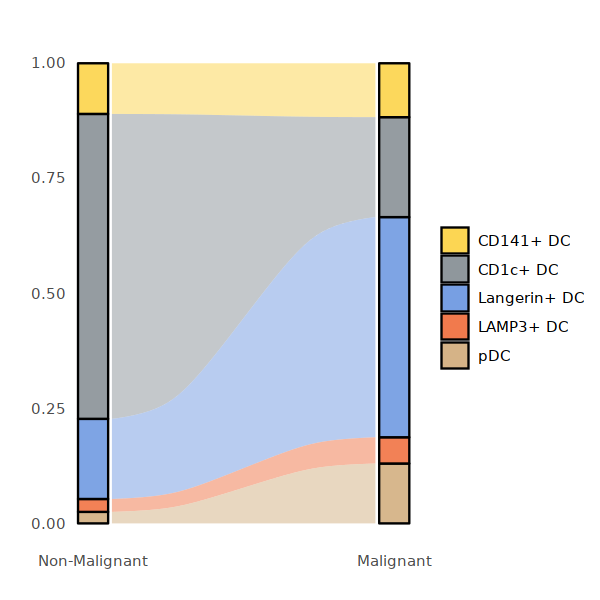
[13]:
options(repr.plot.width=5, repr.plot.height=5)

DC_per <- round(prop.table(table(DC@meta.data[,c("status2", "cell.type.sub3")]), margin=1),3)
DC_per <- data.frame(DC_per)
DC_per$status2 <- factor(DC_per$status2,levels = c("Non-Malignant", "Malignant"))

plot_sank(DC_per, "status2", "cell.type.sub3","Freq", DC_colors)
#ggsave("Fig2C-DC-conditon-frequency-2.pdf",w=5,h=5)
Warning message:
“The `.dots` argument of `group_by()` is deprecated as of dplyr 1.0.0.
This warning is displayed once every 8 hours.
Call `lifecycle::last_lifecycle_warnings()` to see where this warning was generated.”
[14]:
DC@meta.data$patient <- as.vector(unlist(str_extract_all(DC@meta.data$orig.ident, "[[:digit:]]+")))
[ ]:
[15]:
a <- prop.table(table(subset(DC, cell.type.sub3=="pDC")@meta.data[,c("patient", "status2", "cell.type.sub3")]), margin=1)
a <- data.frame(a)
a$status2 <- factor(a$status2,levels = c("Non-Malignant", "Malignant"))
a$patient <- factor(a$patient,levels = c("5", "6", "7", "8", "9", "10", "11", "12", "13", "14", "15", "16"))
[ ]:
[ ]:
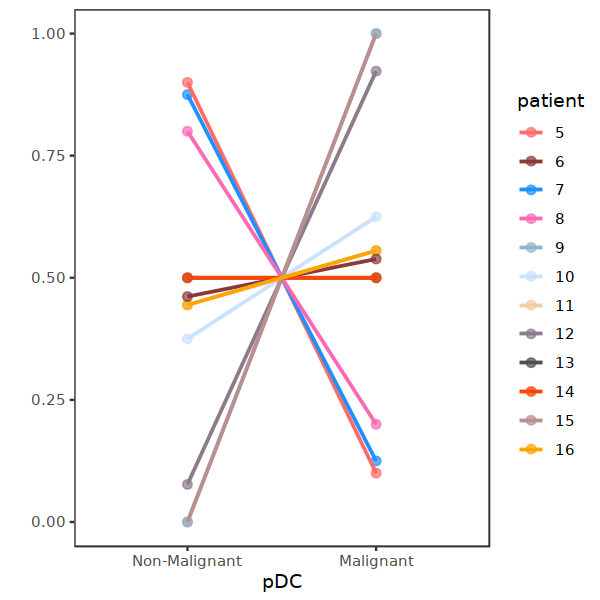
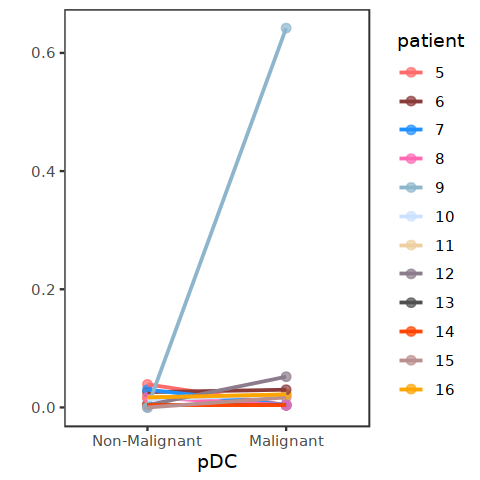
[16]:
b <- subset(a, cell.type.sub3=="pDC")

ggplot(data=b, aes(x=status2, y=Freq, color=patient)) +
        geom_point(size=2, alpha=0.7) +
        geom_line(aes(group=patient) ,size=0.8) + ylab("")+ xlab("pDC") +
        #ylim(0,1) +
        theme_bw() + theme(panel.grid=element_blank()) + scale_color_manual(values = my23colors[10:34])
[ ]:
[54]:
DC_per_patient <- round(prop.table(table(DC@meta.data[,c("patient", "status2", "cell.type.sub3")]), margin=3),3)
DC_per_patient <- data.frame(DC_per_patient)
DC_per_patient$status2 <- factor(DC_per_patient$status2,levels = c("Non-Malignant", "Malignant"))
DC_per_patient$patient <- factor(DC_per_patient$patient,levels = c("5", "6", "7", "8", "9", "10", "11", "12", "13", "14", "15", "16"))

head(DC_per_patient,2)
| patient | status2 | cell.type.sub3 | Freq | |
|---|---|---|---|---|
| <fct> | <fct> | <fct> | <dbl> | |
| 1 | 10 | Malignant | CD141+ DC | 0.029 |
| 2 | 11 | Malignant | CD141+ DC | 0.130 |
[20]:
write.table(DC_per_patient, "DC_per_patient.csv", sep="\t", quote=FALSE)
[22]:
unique(DC_per_patient$cell.type.sub3)
- CD141+ DC
- CD1c+ DC
- Langerin+ DC
- LAMP3+ DC
- pDC
Levels:
- 'CD141+ DC'
- 'CD1c+ DC'
- 'Langerin+ DC'
- 'LAMP3+ DC'
- 'pDC'
[30]:
plot_point_line <- function(per_patient, subcluster="pDC"){
    subcluster_per_patient <- subset(DC_per_patient, cell.type.sub3==subcluster)

    p <- ggplot(data=subcluster_per_patient, aes(x=status2, y=Freq, color=patient)) +
        geom_point(size=2, alpha=0.7) +
        geom_line(aes(group=patient) ,size=0.8) + ylab("")+ xlab(subcluster) +
        #ylim(0,1) +
        theme_bw() + theme(panel.grid=element_blank()) + scale_color_manual(values = my23colors[10:34])

    return(p)
}

library(patchwork)
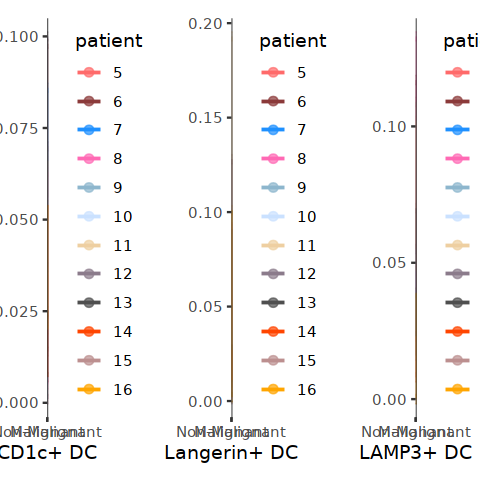
[55]:
p1 <- plot_point_line(DC_per_patient, "CD141+ DC")
p2 <- plot_point_line(DC_per_patient, "CD1c+ DC")
p3 <- plot_point_line(DC_per_patient, "Langerin+ DC")
p4 <- plot_point_line(DC_per_patient, "LAMP3+ DC")
p5 <- plot_point_line(DC_per_patient, "pDC")
[43]:
p1 + p2 + p3 + p4 + p5 + plot_layout(nrow=1, ncol=5)
ggsave("DC_patient_percent.pdf", w=17,h=3)
[56]:
p1
[ ]:
[ ]:
[ ]:
[19]:
options(repr.plot.width=4, repr.plot.height=4)
DC_per_patient_pDC <- subset(DC_per_patient, cell.type.sub3=="pDC")

ggplot(data=DC_per_patient_pDC, aes(x=status2, y=Freq, color=patient)) +
        geom_point(size=2, alpha=0.7) +
        geom_line(aes(group=patient) ,size=0.8) + ylab("")+ xlab("pDC") +
        #ylim(0,1) +
        theme_bw() + theme(panel.grid=element_blank()) + scale_color_manual(values = my23colors[10:34])
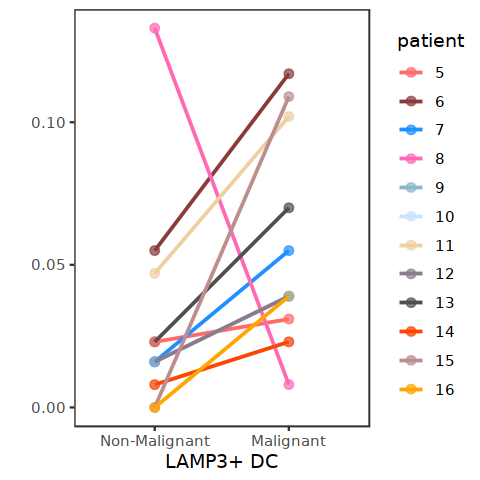
[105]:
options(repr.plot.width=4, repr.plot.height=4)
DC_per_patient_pDC <- subset(DC_per_patient, cell.type.sub3=="LAMP3+ DC")

ggplot(data=DC_per_patient_pDC, aes(x=status2, y=Freq, color=patient)) +
        geom_point(size=2, alpha=0.7) +
        geom_line(aes(group=patient) ,size=0.8) + ylab("")+ xlab("LAMP3+ DC") +
        #ylim(0,1) +
        theme_bw() + theme(panel.grid=element_blank()) + scale_color_manual(values = my23colors[10:34])
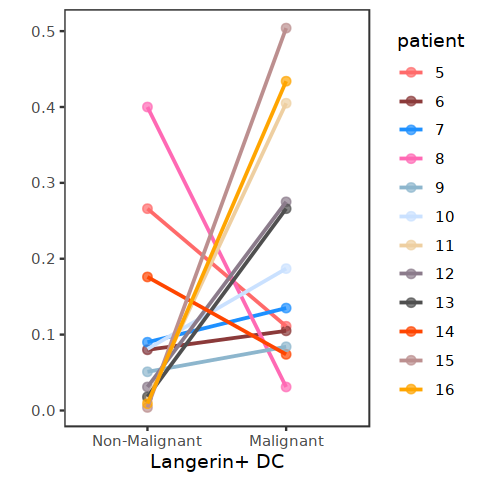
[98]:
options(repr.plot.width=4, repr.plot.height=4)
DC_per_patient_pDC <- subset(DC_per_patient, cell.type.sub3=="Langerin+ DC")

ggplot(data=DC_per_patient_pDC, aes(x=status2, y=Freq, color=patient)) +
        geom_point(size=2, alpha=0.7) +
        geom_line(aes(group=patient) ,size=0.8) + ylab("") + xlab("Langerin+ DC")+
        #ylim(0,1) +
        theme_bw() + theme(panel.grid=element_blank()) + scale_color_manual(values = my23colors[10:34])
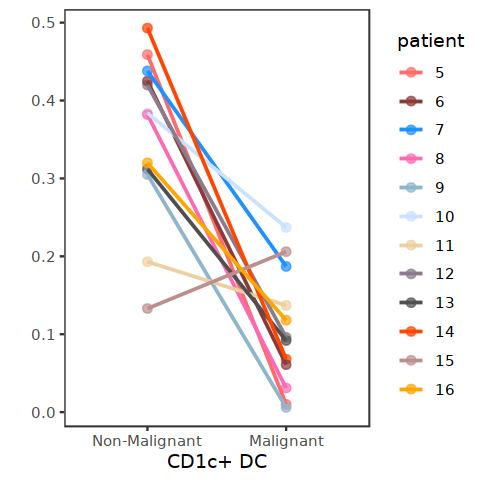
[99]:
options(repr.plot.width=4, repr.plot.height=4)
DC_per_patient_pDC <- subset(DC_per_patient, cell.type.sub3=="CD1c+ DC")

ggplot(data=DC_per_patient_pDC, aes(x=status2, y=Freq, color=patient)) +
        geom_point(size=2, alpha=0.7) +
        geom_line(aes(group=patient) ,size=0.8) + ylab("")+ xlab("CD1c+ DC") +
        #ylim(0,1) +
        theme_bw() + theme(panel.grid=element_blank()) + scale_color_manual(values = my23colors[10:34])
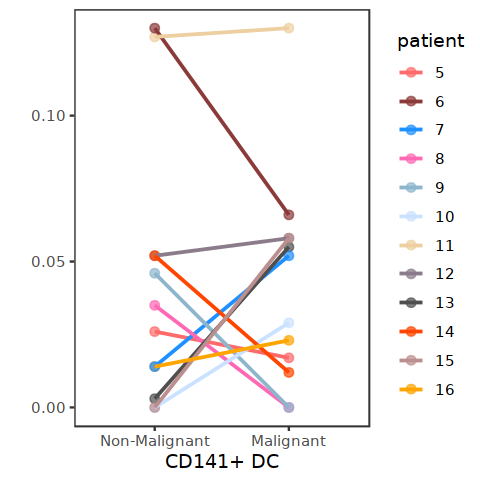
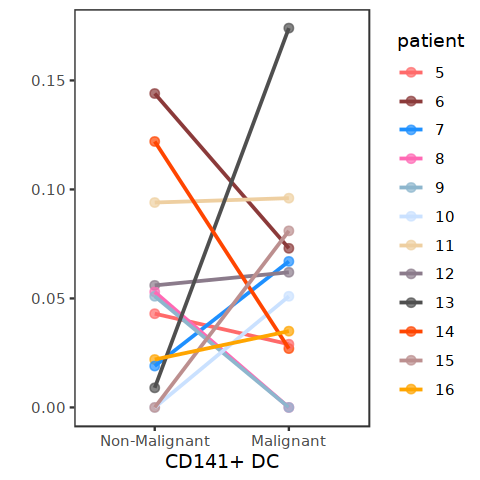
[100]:
options(repr.plot.width=4, repr.plot.height=4)
DC_per_patient_pDC <- subset(DC_per_patient, cell.type.sub3=="CD141+ DC")

ggplot(data=DC_per_patient_pDC, aes(x=status2, y=Freq, color=patient)) +
        geom_point(size=2, alpha=0.7) +
        geom_line(aes(group=patient) ,size=0.8) + ylab("") + xlab("CD141+ DC") +
        #ylim(0,1) +
        theme_bw() + theme(panel.grid=element_blank()) + scale_color_manual(values = my23colors[10:34])
[ ]:
[ ]:
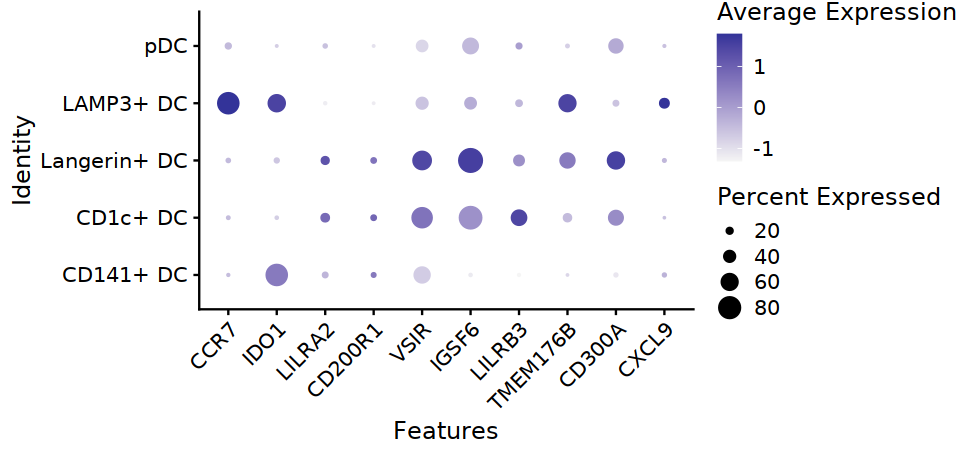
[12]:
options(repr.plot.width=8, repr.plot.height=3.8)
DC_markers <- c("CCR7", "IDO1", "LILRA2", "CD200R1", "VSIR", "IGSF6", "LILRB3", "TMEM176B", "CD300A", "CXCL9")
DotPlot(DC, features=DC_markers, group.by="cell.type.sub3", cols=c("#F5F5F5", "#333399")) +
    theme(axis.text.x=element_text(angle=45,hjust=1,size=12), axis.text=element_text(size=12))

ggsave("Fig2D-DC-markers-dot.pdf",w=8,h=3.8)
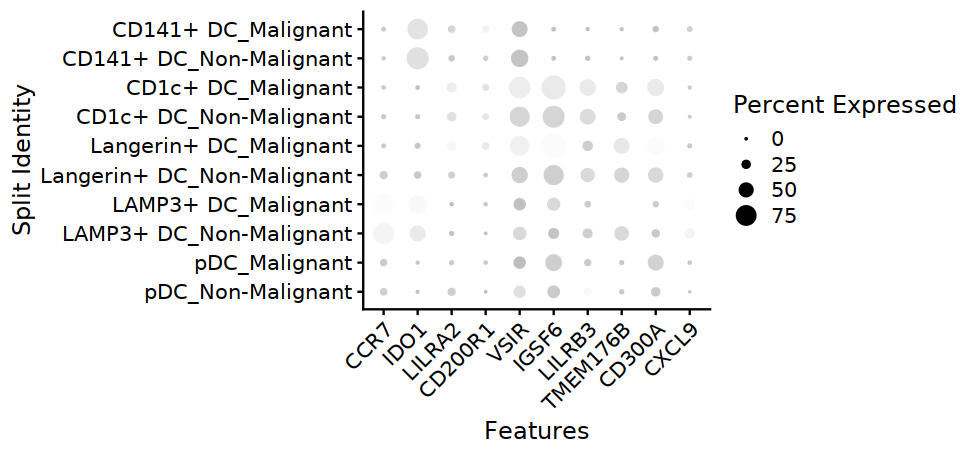
[13]:
options(repr.plot.width=8, repr.plot.height=3.8)

DC@meta.data$cell.type.sub3 <- factor(DC@meta.data$cell.type.sub3,
                                      levels = c("pDC", "LAMP3+ DC", "Langerin+ DC", "CD1c+ DC", "CD141+ DC"))


DotPlot(DC, features=DC_markers, group.by="cell.type.sub3", split.by="status2", cols=c("#F5F5F5", "#333399")) +
    theme(axis.text.x=element_text(angle=45,hjust=1,size=12), axis.text=element_text(size=12))
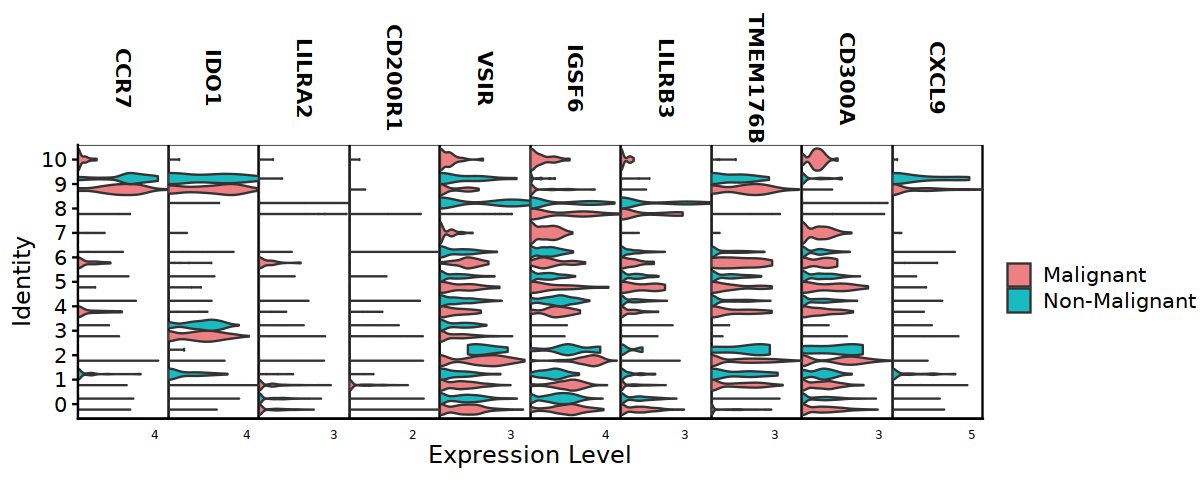
[14]:
options(repr.plot.width=10, repr.plot.height=4)

#DC@meta.data$cell.type.sub3 <- factor(DC@meta.data$cell.type.sub3,
#                                      levels = c("CD141+ DC", "CD1c+ DC", "Langerin+ DC", "LAMP3+ DC", "pDC"))

DC@meta.data$cell.type.sub3 <- factor(DC@meta.data$cell.type.sub3,
                                      levels = c("pDC", "LAMP3+ DC", "Langerin+ DC", "CD1c+ DC", "CD141+ DC"))

VlnPlot(DC, features=DC_markers, split.by="status2", stack=TRUE,
            cols = c('#EE8084','#19BBC1'), assay="RNA", slot="data",
            pt.size = 0) +
        theme(axis.ticks.x=element_blank()) +
        theme(axis.text.y=element_text(angle=0,hjust=1,size=12))

#ggsave("Fig2D-DC-markers-vln-cmp.pdf",w=10,h=4)
The default behaviour of split.by has changed.
Separate violin plots are now plotted side-by-side.
To restore the old behaviour of a single split violin,
set split.plot = TRUE.

This message will be shown once per session.

Warning message:
“Groups with fewer than two data points have been dropped.”
Warning message:
“Groups with fewer than two data points have been dropped.”
Warning message:
“Groups with fewer than two data points have been dropped.”
Warning message:
“Groups with fewer than two data points have been dropped.”
Warning message:
“Groups with fewer than two data points have been dropped.”
Warning message:
“Groups with fewer than two data points have been dropped.”
Warning message:
“Groups with fewer than two data points have been dropped.”
Warning message:
“Groups with fewer than two data points have been dropped.”
Warning message:
“Groups with fewer than two data points have been dropped.”
Warning message:
“Groups with fewer than two data points have been dropped.”
[ ]:
VlnPlot(DC, features=DC_markers, split.by="status2", stack=TRUE,
            cols = c('#EE8084','#19BBC1'), assay="RNA", slot="data",
            pt.size = 0) +
        theme(axis.ticks.x=element_blank()) +
        theme(axis.text.y=element_text(angle=0,hjust=1,size=12))
[10]:
DC_rmpDC <- subset(DC, cell.type.sub3 != "pDC")
DC_rmpDC@meta.data$cell.type.sub3 <- factor(DC_rmpDC@meta.data$cell.type.sub3,
                                      #levels = c("LAMP3+ DC", "Langerin+ DC", "CD1c+ DC", "CD141+ DC"))
                                      levels = c("CD141+ DC", "CD1c+ DC", "Langerin+ DC", "LAMP3+ DC"))
[ ]:
options(repr.plot.width=7, repr.plot.height=3)

DC_markers_final <- c("CLEC9A","LAMP3","CCR7","CD80","CD86","IDO1","HLA-DRA","CD207")


VlnPlot(DC_rmpDC, features=DC_markers_final, group.by="cell.type.sub3", stack=TRUE,
        assay="RNA", slot="data",
            pt.size = 0) +
        theme(axis.ticks.x=element_blank()) +
        theme(axis.text.y=element_text(angle=0,hjust=1,vjust=0,size=12)) +
        ylab("")

ggsave("Fig2D-DC-markers-vln-cmp.pdf",w=6,h=3)
[ ]:
[ ]:
[64]:
modify_vlnplot<- function(obj,
                          features,
                          pt.size = 0,
                          plot.margin = unit(c(-0.75, 0, -0.75, 0), "cm"),
                          cols=my23colors,
                          slot="data",
                          assay="RNA",
                          ...) {
  p <- VlnPlot(obj, features = features, pt.size = pt.size, cols=cols, slot=slot,
              assay=assay,... )  +
    xlab("") + ylab(features) + ggtitle("") +
    theme(legend.position = "none",
          axis.text.x = element_blank(),
          axis.text.y = element_blank(),
          axis.ticks.x = element_blank(),
          #axis.ticks.y = element_line(),
          axis.ticks.y = element_blank(),
          plot.title= element_blank(),
          #axis.title.x = element_blank(),
          #axis.title.x = element_text(size = rel(1), angle = 45, vjust = 0),
          axis.title.y = element_text(size = rel(1), angle=0, vjust = 0.5, hjust = 0),
          plot.margin = plot.margin )
  return(p)
}


## main function
StackedVlnPlot<- function(obj, features,
                          pt.size = 0,
                          slot="data",
                          assay="RNA",
                          plot.margin = unit(c(0, 0, 0, 0), "cm"),
                          ...) {

  plot_list<- purrr::map(features, function(x) modify_vlnplot(obj = obj, features = x, slot=slot, assay=assay,...))
  plot_list[[length(plot_list)]]<- plot_list[[length(plot_list)]] +
    theme(axis.text.x=element_text(size = rel(1), angle = 45, vjust = 1, hjust = 1), axis.ticks.x = element_line()) #+
    #theme(axis.title.y=element_text(size = rel(1), angle = 0, vjust = 0.5, hjust = 0), axis.ticks.y = element_blank())

  p <- patchwork::wrap_plots(plotlist = plot_list, ncol = 1, heights=0.5)
  return(p)
}

options(repr.plot.width=6, repr.plot.height=10)


#StackedVlnPlot(DC, features=DC_markers, split.by="status2", cols= c('#EE8084','#19BBC1'),
#            pt.size = 0) #+
        #theme(axis.ticks.y=element_blank()) +
        #theme(axis.text.x=element_text(angle=0,hjust=1,size=12)) + theme(legend.position="right")
[ ]:
[ ]:
[ ]:
[ ]:
[48]:
DC
Error in eval(expr, envir, enclos): 找不到对象'DC'
Traceback:
read DC#
[60]:
Idents(DC) <- "cell.type.sub3"

subDC <- subset(DC, cell.type.sub3 != "pDC")
[61]:
options(repr.plot.width=5, repr.plot.height=4)
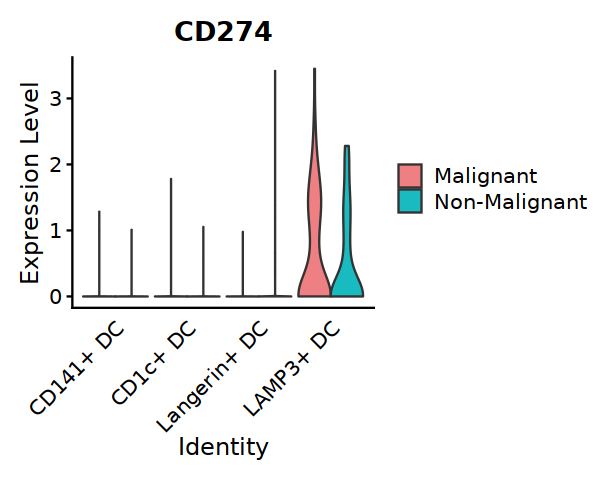
VlnPlot(subDC, features=c("CD274"), split.by="status2",
cols = c('#EE8084','#19BBC1'), assay="RNA", slot="data",
pt.size = 0) +
theme(axis.ticks.x=element_blank()) +
theme(axis.text.y=element_text(angle=0,hjust=1,size=12))
#ggsave("Fig5A-1-CD274-in-DC.pdf", w=5, h=4)
[63]:
library(ggsci)
#library(ggpubr)
library(ggunchained)
library(ggthemes)

DC_CD274_exp <- subset(DC, cell.type.sub3 != "pDC")@meta.data
DC_CD274_exp$CD274 <- subset(DC, cell.type.sub3 != "pDC")@assays$RNA@data["CD274",]
[64]:
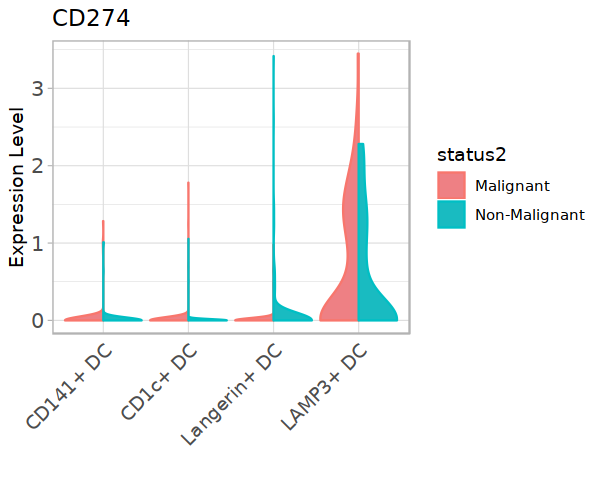
options(repr.plot.width=5, repr.plot.height=4)

p <- ggplot(DC_CD274_exp, aes(color = status2, x=cell.type.sub3, y=CD274, fill=status2)) +
        geom_split_violin(scale='width', stat="ydensity",trim = TRUE, na.rm=TRUE) + theme_light() +
        theme(axis.ticks.x=element_blank()) +
        theme(axis.text.x=element_text(angle=45,hjust=1,size=11)) +
        theme(axis.text.y=element_text(size=12)) +
        xlab("") + ylab("Expression Level") + labs(title = "CD274") +
        scale_fill_manual(values=c('#EE8084','#19BBC1'))
p

#ggsave("Fig5A-1-CD274-in-DC.pdf",w=5,h=4)
Tcell#
[66]:
Tcell <- readRDS("T_clean_5thAnnotation.rds")
[67]:
Tcell@meta.data$status2 <- "Malignant"
Tcell@meta.data[Tcell@meta.data$status == "P", "status2"] <- "Non-Malignant"
Tcell@meta.data[Tcell@meta.data$status == "T", "status2"] <- "Malignant"

Tcell@meta.data$status2 <- factor(Tcell@meta.data$status2,levels = c("Malignant", "Non-Malignant"))
#
[68]:
Tcell@meta.data$treat <- "NoTreat"
Tcell@meta.data[Tcell@meta.data$patient == "MIBC5", "treat"] <- "Treat"
Tcell@meta.data[Tcell@meta.data$patient == "MIBC6", "treat"] <- "Treat"
Tcell@meta.data[Tcell@meta.data$patient == "MIBC8", "treat"] <- "Treat"
Tcell@meta.data[Tcell@meta.data$patient == "MIBC13", "treat"] <- "Treat"
[ ]:
[69]:
head(Tcell@meta.data,2)
Tcell@meta.data$status_treat <- paste(Tcell@meta.data$status2, Tcell@meta.data$treat, sep="_")
| orig.ident | nCount_RNA | nFeature_RNA | seurat_clusters | cell.type | db.score | mt.percentage | S.Score | G2M.Score | Phase | ⋯ | orig.clusters | RNA_snn_res.1 | RNA_snn_res.1.2 | RNA_snn_res.1.1 | RNA_snn_res.1.15 | RNA_snn_res.1.25 | anno.by.cluster | cell.type.sub | status2 | treat | |
|---|---|---|---|---|---|---|---|---|---|---|---|---|---|---|---|---|---|---|---|---|---|
| <fct> | <dbl> | <int> | <fct> | <fct> | <dbl> | <dbl> | <dbl> | <dbl> | <fct> | ⋯ | <fct> | <fct> | <fct> | <fct> | <fct> | <fct> | <fct> | <fct> | <fct> | <chr> | |
| MIBC5P.AAACCCAAGAGAAGGT | MIBC5P | 4394.585 | 1674 | 6 | T | 0.03571429 | 0.08269632 | 0.01501669 | -0.07550963 | S | ⋯ | 7 | 9 | 9 | 7 | 8 | 6 | gdT-antitumor | gdT-antitumor | Non-Malignant | Treat |
| MIBC5P.AAACCCATCAGACTGT | MIBC5P | 4446.459 | 1635 | 4 | T | 0.01785714 | 0.02878687 | 0.16037660 | 0.01176989 | S | ⋯ | 4 | 4 | 4 | 1 | 5 | 4 | CD4-Treg(naïve) | CD4-Treg(naïve) | Non-Malignant | Treat |
APC sides#
CD274(PD-L1),CD273(PD-L2),CD276(B7-H3),LGALS9(Gal-9),HAVCR2(TIM3),CD80,CD86,BTLA,HVEM(TNFRSF14),4-1BBL(TNFSF9),CD40,B7RP1
c(“CD274”, “CD273”, “CD276”, “LGALS9”, “HAVCR2”, “CD80”, “CD86”, “BTLA”, “TNFRSF14”, “TNFSF9”, “CD40”, “B7RP1”)
Tsides#
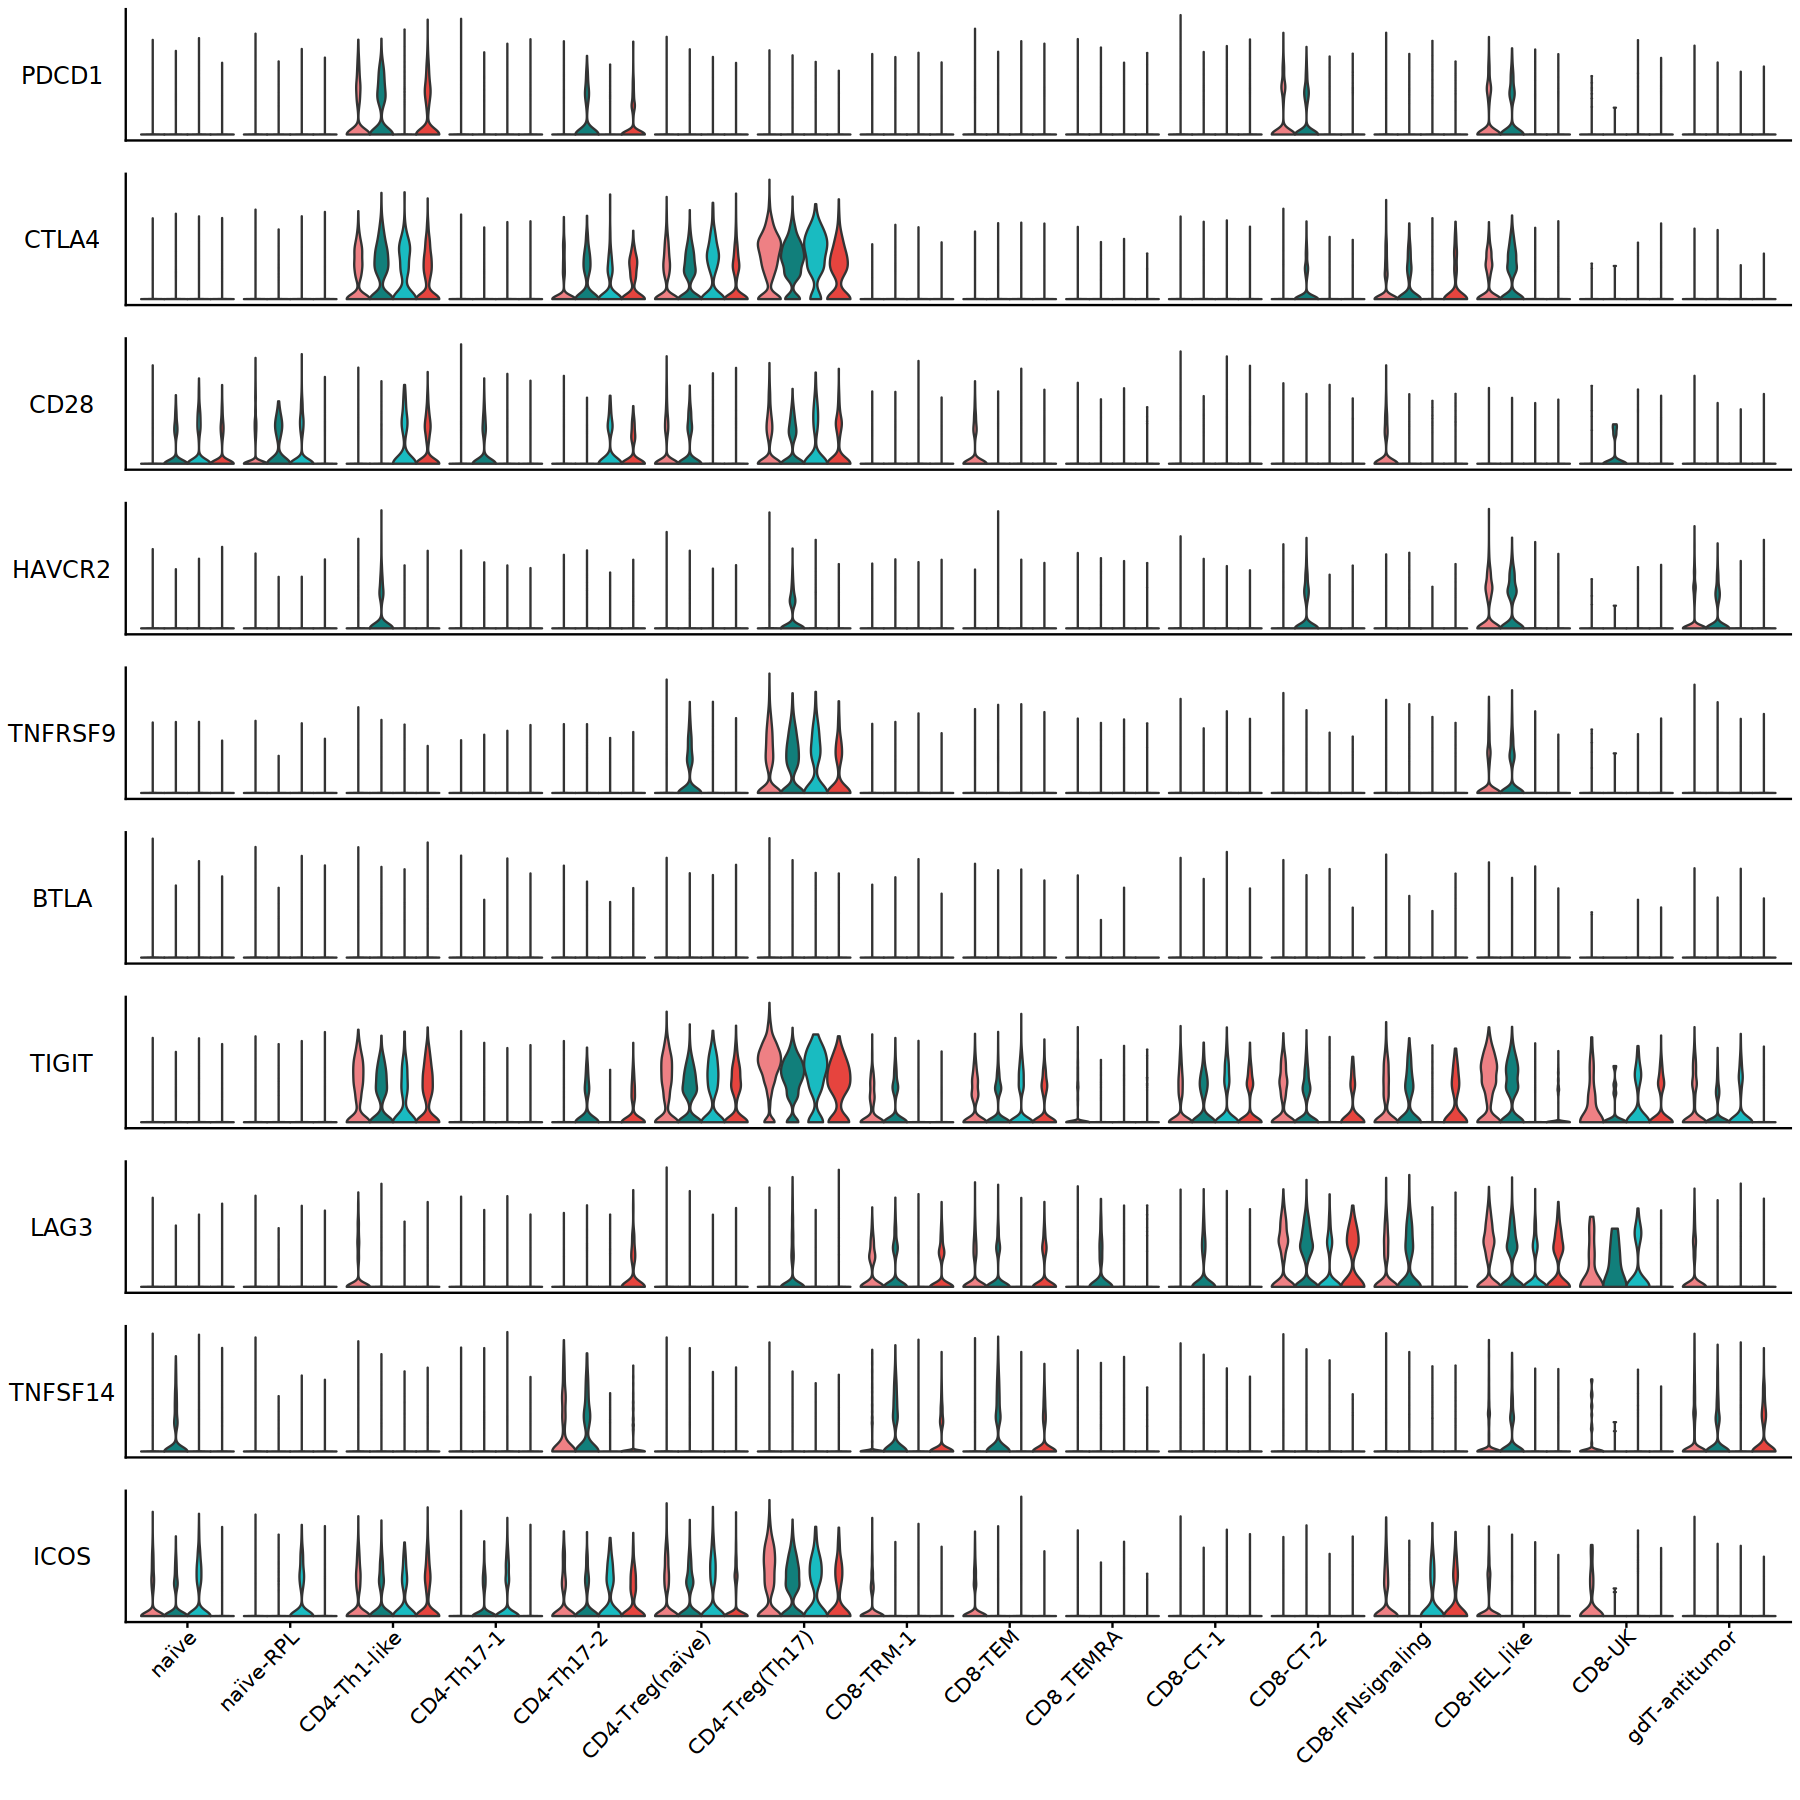
T side:PD-1(PDCD1),CTLA-4,CD28, HAVCR2(TIM3),4-1BB(TNFRSF9),BTLA,TIGIT,LAG3(CD223),TNFSF14(LIGHT),CD40L,ICOS」
[67]:
head(DC@meta.data,2)
DC@meta.data$status_treat <- paste(DC@meta.data$status2, DC@meta.data$treat, sep="_")
| orig.ident | nCount_RNA | nFeature_RNA | seurat_clusters | cell.type.v1 | status | patient | Mye.ct | sub.ct | RNA_snn_res.0.5 | RNA_snn_res.0.4 | RNA_snn_res.0.7 | RNA_snn_res.1 | cell.type.sub2 | cell.type.sub1 | RNA_snn_res.0.2 | cell.type.sub3 | status2 | treat | |
|---|---|---|---|---|---|---|---|---|---|---|---|---|---|---|---|---|---|---|---|
| <fct> | <dbl> | <int> | <fct> | <fct> | <fct> | <chr> | <chr> | <chr> | <fct> | <fct> | <fct> | <fct> | <chr> | <fct> | <fct> | <fct> | <fct> | <chr> | |
| MIBC5P.ATGGTTGAGTGACACG | MIBC5P | 22882.655 | 4557 | 3 | Mye | P | 5 | cDC | cDC - 0 | 10 | 10 | 12 | 15 | DC – CLEC9A+WDFY4+ | DC | 3 | CD141+ DC | Non-Malignant | Treat |
| MIBC5P.CGCAGGTGTTTGGGTT | MIBC5P | 5257.862 | 1614 | 3 | Mye | P | 5 | cDC | cDC - 3 | 10 | 10 | 12 | 15 | DC – CLEC9A+WDFY4+ | DC | 3 | CD141+ DC | Non-Malignant | Treat |
[73]:
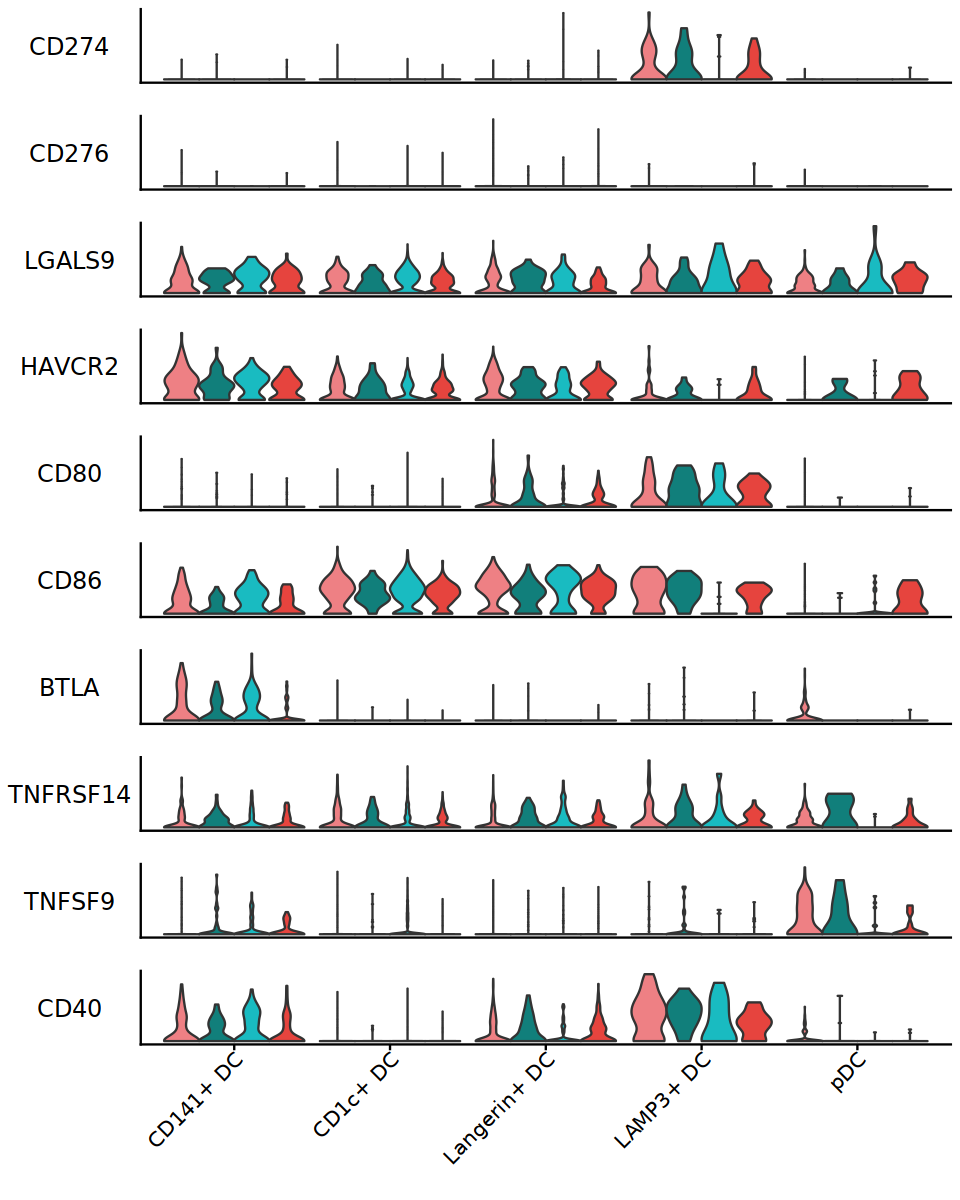
options(repr.plot.width=8, repr.plot.height=10)
APCside_genes <- c("CD274", "CD276", "LGALS9", "HAVCR2", "CD80", "CD86", "BTLA", "TNFRSF14", "TNFSF9", "CD40")
StackedVlnPlot(DC, features=APCside_genes, split.by="status_treat", cols= c('#EE8084','#19BBC1'), pt.size = 0)
ggsave("/annoroad/data1/bioinfo/PROJECT/big_Commercial/Cooperation/B_TET/B_TET-003/std/result/fanxuning/commander_test/THU/APCside_genes_in_DC.pdf", w=6, h=6)
[99]:
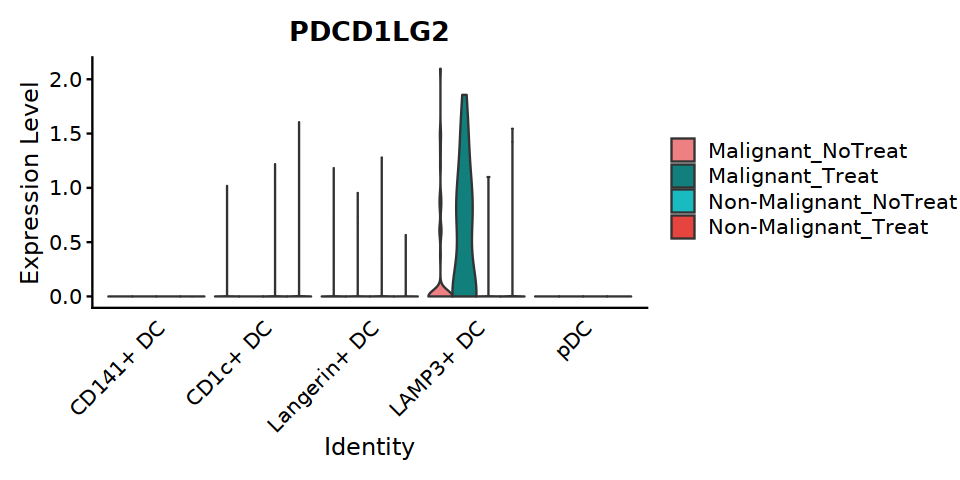
options(repr.plot.width=8, repr.plot.height=4)
VlnPlot(DC, features=c("PDCD1LG2"), ,split.by="status_treat", group.by="cell.type.sub3",
            cols = c('#EE8084','#19BBC1'),
            pt.size = 0) +
        theme(axis.ticks.x=element_blank()) +
        theme(axis.text.y=element_text(angle=0,hjust=1,size=12))
[ ]:
[70]:
Idents(Tcell) <- "cell.type.sub"
[44]:
options(repr.plot.width=15, repr.plot.height=15)

Tside_genes <- c("PDCD1", "CTLA4", "CD28", "HAVCR2", "TNFRSF9", "BTLA", "TIGIT", "LAG3", "TNFSF14", "ICOS")
StackedVlnPlot(Tcell, features=Tside_genes, split.by="status_treat", cols= c('#EE8084','#19BBC1'), pt.size = 0)
ggsave("/annoroad/data1/bioinfo/PROJECT/big_Commercial/Cooperation/B_TET/B_TET-003/std/result/fanxuning/commander_test/THU/Tside_genes.pdf", w=15, h=15)
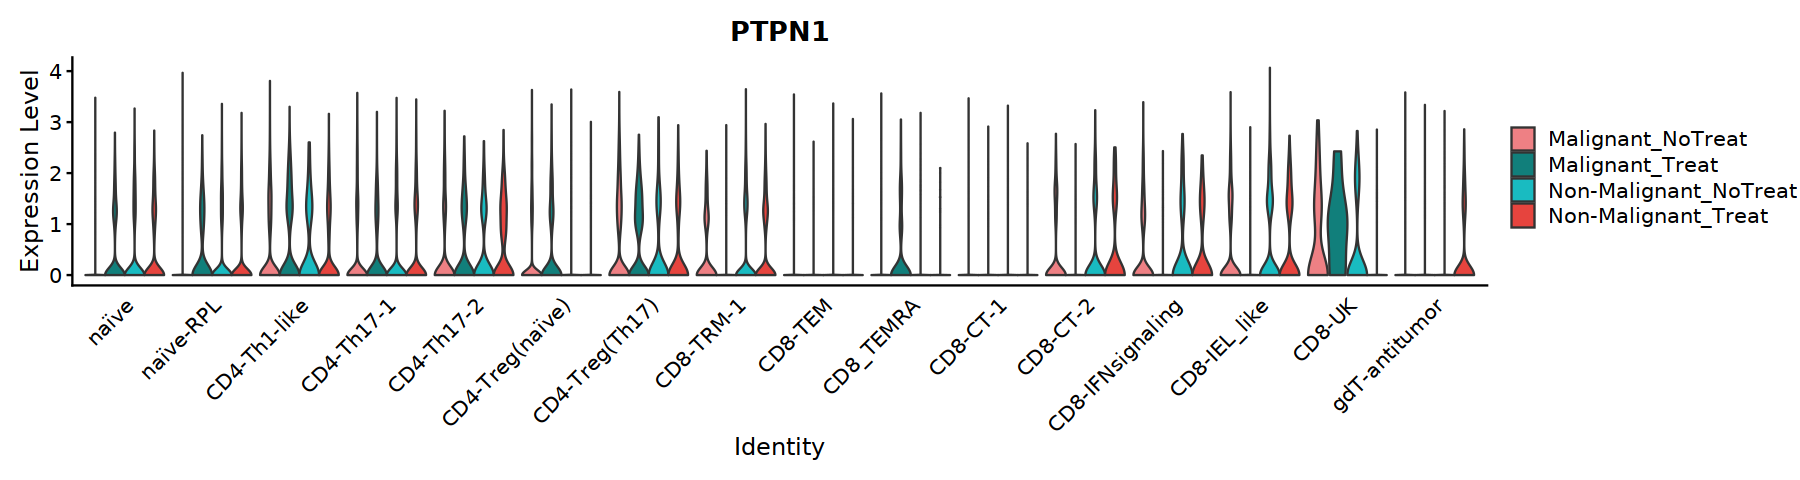
[109]:
options(repr.plot.width=15, repr.plot.height=4)


VlnPlot(Tcell, features=c("PTPN1"), ,split.by="status_treat", group.by="cell.type.sub",
            cols = c('#EE8084','#19BBC1'),
            pt.size = 0) +
        theme(axis.ticks.x=element_blank()) +
        theme(axis.text.y=element_text(angle=0,hjust=1,size=12))
[72]:
options(repr.plot.width=15, repr.plot.height=15)

Tside_genes2 <- c("PDCD1", "CTLA4", "TIGIT", "HAVCR2", "LAG3", "BTLA", "TNFSF14", "TNFRSF9", "TNFRSF4")
StackedVlnPlot(Tcell, features=Tside_genes2, split.by="status_treat", cols= c('#EE8084','#19BBC1'), pt.size = 0)
#ggsave("/annoroad/data1/bioinfo/PROJECT/big_Commercial/Cooperation/B_TET/B_TET-003/std/result/fanxuning/commander_test/THU/Tside_genes.pdf", w=15, h=15)
Error in file(con, "rb"): 无法打开链结
Traceback:
plot without title
[ ]:
[ ]:
[ ]:
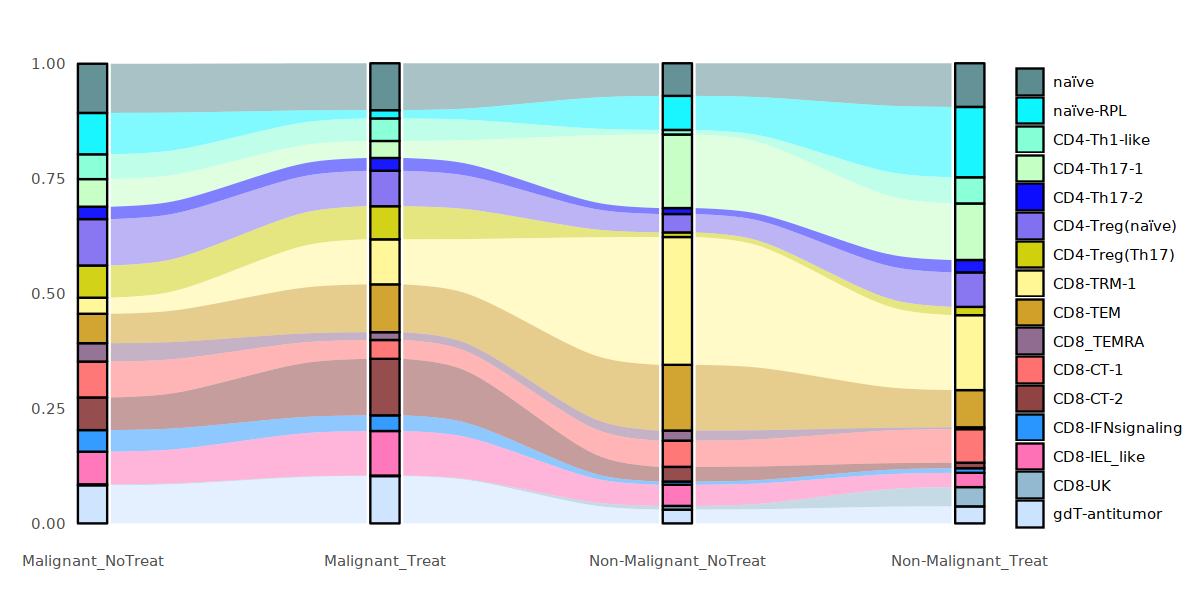
[116]:
options(repr.plot.width=10, repr.plot.height=5)

Tcell_p <- round(prop.table(table(Tcell@meta.data[,c("status_treat", "cell.type.sub")]), margin=1),3)
Tcell_p <- data.frame(Tcell_p)
#Tcell$status_treat <- factor(Tcell$status2,levels = c("Non-Malignant", "Malignant"))

plot_sank(Tcell_p, "status_treat", "cell.type.sub","Freq", my24_1colors)
[120]:
colnames(Tcell@meta.data)
- 'orig.ident'
- 'nCount_RNA'
- 'nFeature_RNA'
- 'seurat_clusters'
- 'cell.type'
- 'db.score'
- 'mt.percentage'
- 'S.Score'
- 'G2M.Score'
- 'Phase'
- 'sample.cluster'
- 'RNA_snn_res.0.25'
- 'cell.type.v1'
- 'status'
- 'patient'
- 'patient.P'
- 'RNA_snn_res.1.5'
- 'orig.clusters'
- 'RNA_snn_res.1'
- 'RNA_snn_res.1.2'
- 'RNA_snn_res.1.1'
- 'RNA_snn_res.1.15'
- 'RNA_snn_res.1.25'
- 'anno.by.cluster'
- 'cell.type.sub'
- 'status2'
- 'treat'
- 'status_treat'
[ ]:
[ ]:
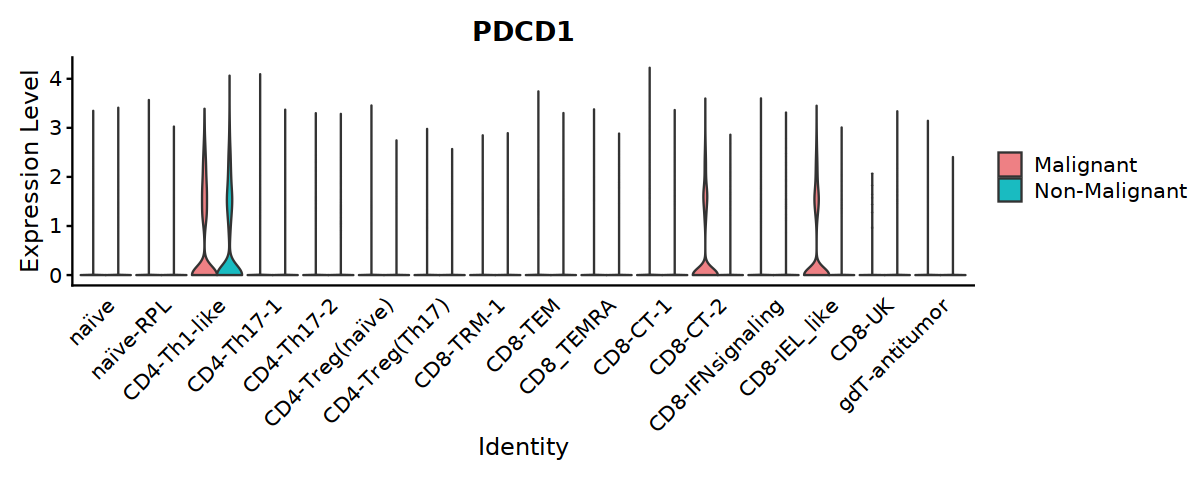
[24]:
options(repr.plot.width=10, repr.plot.height=4)

Idents(Tcell) <- "cell.type.sub"

VlnPlot(Tcell, features=c("PDCD1"), ,split.by="status2", group.by="cell.type.sub",
            cols = c('#EE8084','#19BBC1'),
            pt.size = 0) +
        theme(axis.ticks.x=element_blank()) +
        theme(axis.text.y=element_text(angle=0,hjust=1,size=12))
[25]:
options(repr.plot.width=10, repr.plot.height=4)

Idents(Tcell) <- "cell.type.sub"

VlnPlot(Tcell, features=c("PDCD1"), ,split.by="status2", group.by="cell.type.sub",
            cols = c('#EE8084','#19BBC1'),
            pt.size = 0) +
        theme(axis.ticks.x=element_blank()) +
        theme(axis.text.y=element_text(angle=0,hjust=1,size=12))

#ggsave("Fig5A-2-PDCD1-in-Tcell.pdf", w=10, h=4)
#ggsave("Fig5B-PDCD1-in-Tcell.pdf", w=10, h=4)

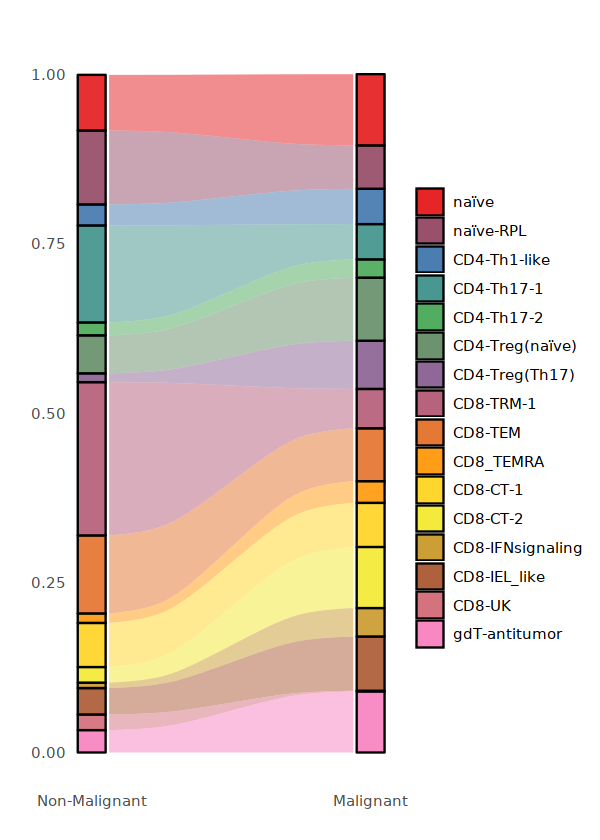
[29]:
library(RColorBrewer)
Tcell_cluster_cols<-colorRampPalette(brewer.pal(8, "Set1"))(16)

options(repr.plot.width=5, repr.plot.height=7)

Tcell_per <- data.frame(round(prop.table(table(Tcell@meta.data[,c("status2", "cell.type.sub")]), margin=1),3))

Tcell_per$status2 <- factor(Tcell_per$status2,levels = c("Non-Malignant", "Malignant"))

plot_sank(Tcell_per, "status2", "cell.type.sub", "Freq", Tcell_cluster_cols)

ggsave("FigS2-Tcell-conditon-frequency.pdf",w=5,h=7)
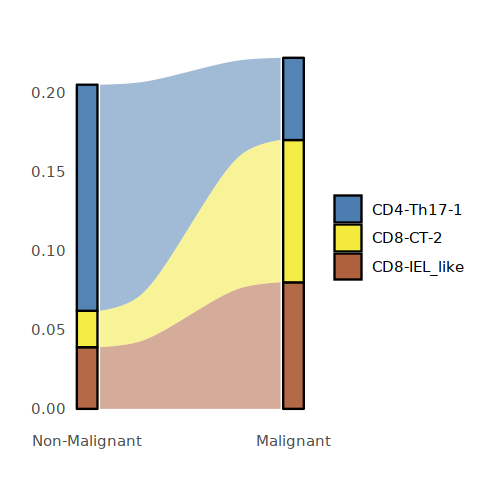
[21]:
options(repr.plot.width=4, repr.plot.height=4)
library(RColorBrewer)
Tcell_cluster_cols<-colorRampPalette(brewer.pal(8, "Set1"))(16)

Tcell_per <- data.frame(round(prop.table(table(Tcell@meta.data[,c("status2", "cell.type.sub")]), margin=1),3))

Tcell_per$status2 <- factor(Tcell_per$status2,levels = c("Non-Malignant", "Malignant"))
Tcell_per <- subset(Tcell_per, cell.type.sub %in% c("CD4-Th17-1", "CD8-CT-2", "CD8-IEL_like"))

plot_sank(Tcell_per, "status2", "cell.type.sub", "Freq", c(Tcell_cluster_cols[3], Tcell_cluster_cols[12],Tcell_cluster_cols[14]))

ggsave("Fig5D-Tcell-PDCD1_cluster_conditon-frequency.pdf",w=4,h=4)
[16]:
unique(Tcell_per$cell.type.sub)
- naïve
- naïve-RPL
- CD4-Th1-like
- CD4-Th17-1
- CD4-Th17-2
- CD4-Treg(naïve)
- CD4-Treg(Th17)
- CD8-TRM-1
- CD8-TEM
- CD8_TEMRA
- CD8-CT-1
- CD8-CT-2
- CD8-IFNsignaling
- CD8-IEL_like
- CD8-UK
- gdT-antitumor
Levels:
- 'naïve'
- 'naïve-RPL'
- 'CD4-Th1-like'
- 'CD4-Th17-1'
- 'CD4-Th17-2'
- 'CD4-Treg(naïve)'
- 'CD4-Treg(Th17)'
- 'CD8-TRM-1'
- 'CD8-TEM'
- 'CD8_TEMRA'
- 'CD8-CT-1'
- 'CD8-CT-2'
- 'CD8-IFNsignaling'
- 'CD8-IEL_like'
- 'CD8-UK'
- 'gdT-antitumor'
[ ]:
print(1)
[21]:
Tcell
Error in eval(expr, envir, enclos): 找不到对象'Tcell'
Traceback:
[ ]:
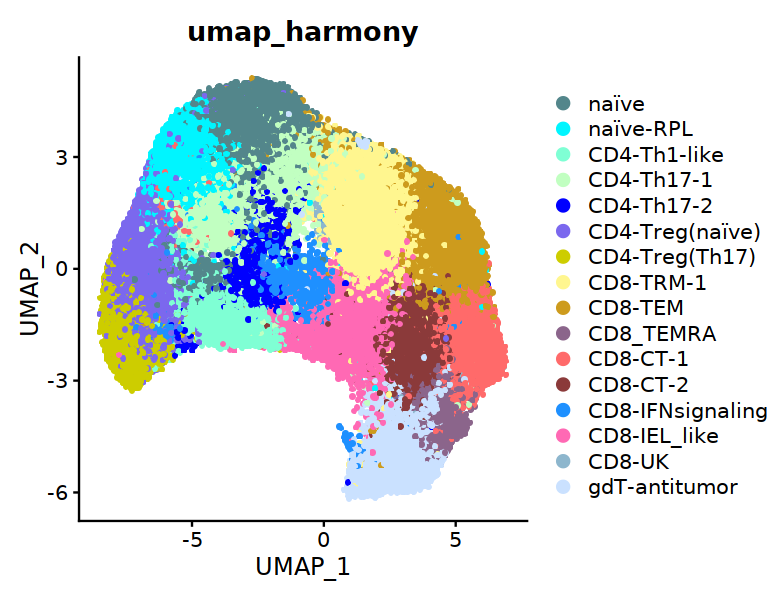
[30]:
options(repr.plot.width=6.5, repr.plot.height=5)
DimPlot(Tcell,  group.by="cell.type.sub", reduction="umap_harmony", raster=TRUE, cols=my24_1colors,
        label=FALSE,pt.size=3) + labs(title="umap_harmony")
[31]:
print(1)
[1] 1
[42]:
DC_var_features <- DC@assays$RNA@var.features
Tcell_var_features <- Tcell@assays$RNA@var.features
[43]:
write.table(DC_var_features, "/annoroad/data1/bioinfo/PROJECT/big_Commercial/Cooperation/B_TET/B_TET-072/supplement/yaojiaying/AN202202140002/Analysis/Analysis/3.cellphonedb/DC_var_features.list",quote=FALSE)
write.table(Tcell_var_features, "/annoroad/data1/bioinfo/PROJECT/big_Commercial/Cooperation/B_TET/B_TET-072/supplement/yaojiaying/AN202202140002/Analysis/Analysis/3.cellphonedb/Tcell_var_features.list",quote=FALSE)
[57]:
sub1 <- DC@meta.data[DC@meta.data$cell.type.sub3=="CD1c+ DC",]
[69]:
Idents(DC)<-'cell.type.sub3'
cluster.averages <- AverageExpression(object = DC, assays ="RNA", slot="count", return.seurat = F)
[70]:
head(cluster.averages$RNA)
| pDC | LAMP3+ DC | Langerin+ DC | CD1c+ DC | CD141+ DC | |
|---|---|---|---|---|---|
| MIR1302-2HG | 0 | 0 | 0.000000000 | 0.000000000 | 0.00000000 |
| FAM138A | 0 | 0 | 0.000000000 | 0.000000000 | 0.00000000 |
| OR4F5 | 0 | 0 | 0.000000000 | 0.000000000 | 0.00000000 |
| AL627309.1 | 0 | 0 | 0.004085576 | 0.002927716 | 0.00288774 |
| AL627309.3 | 0 | 0 | 0.000000000 | 0.000000000 | 0.00000000 |
| AL627309.2 | 0 | 0 | 0.000000000 | 0.000000000 | 0.00000000 |
[71]:
cluster.averages$RNA["HBEGF",]
- pDC
- 0.294666604364938
- LAMP3+ DC
- 0.733322150415866
- Langerin+ DC
- 2.36255005661162
- CD1c+ DC
- 3.03976304361418
- CD141+ DC
- 0.129130811397768
[68]:
cluster.averages$RNA["CD44",]
- pDC
- 1.62101472576632
- LAMP3+ DC
- 5.28350384648294
- Langerin+ DC
- 2.95375122623925
- CD1c+ DC
- 5.01339024237718
- CD141+ DC
- 1.06607057706537
[5]:
Mye <- readRDS("/annoroad/data1/bioinfo/PROJECT/big_Commercial/Cooperation/B_TET/B_TET-072/supplement/yaojiaying/AN202202140002/Analysis/Data/V1_Celltype_Mye_3nd_withAnnotation.rds")
[79]:
head(Mye@meta.data,2)
| orig.ident | nCount_RNA | nFeature_RNA | seurat_clusters | cell.type.v1 | status | patient | Mye.ct | sub.ct | RNA_snn_res.0.5 | RNA_snn_res.0.4 | RNA_snn_res.0.7 | RNA_snn_res.1 | cell.type.sub2 | cell.type.sub1 | cell.type.sub | |
|---|---|---|---|---|---|---|---|---|---|---|---|---|---|---|---|---|
| <fct> | <dbl> | <int> | <fct> | <fct> | <fct> | <fct> | <chr> | <chr> | <fct> | <fct> | <fct> | <fct> | <chr> | <chr> | <fct> | |
| MIBC5P.ATGGTTGAGTGACACG | MIBC5P | 22882.655 | 4557 | 15 | Mye | P | MIBC5 | cDC | cDC - 0 | 10 | 10 | 12 | 15 | DC – CLEC9A+WDFY4+ | DC | DC – CLEC9A+WDFY4+ |
| MIBC5P.CGCAGGTGTTTGGGTT | MIBC5P | 5257.862 | 1614 | 15 | Mye | P | MIBC5 | cDC | cDC - 3 | 10 | 10 | 12 | 15 | DC – CLEC9A+WDFY4+ | DC | DC – CLEC9A+WDFY4+ |
[6]:
print("00")
[1] "00"
[58]:
Mye_final <- readRDS("/annoroad/data1/bioinfo/PROJECT/big_Com mercial/Cooperation/B_TET/B_TET-003/std/result/fanxuning/commander_test/THU/final_Mye.RDS")
[59]:
head(Mye_final@meta.data, 2)
| orig.ident | nCount_RNA | nFeature_RNA | seurat_clusters | cell.type.v1 | status | patient | Mye.ct | sub.ct | RNA_snn_res.0.5 | RNA_snn_res.0.4 | RNA_snn_res.0.7 | RNA_snn_res.1 | cell.type.sub2 | cell.type.sub1 | cell.type.sub | cell.type.sub3 | status2 | |
|---|---|---|---|---|---|---|---|---|---|---|---|---|---|---|---|---|---|---|
| <fct> | <dbl> | <int> | <fct> | <fct> | <fct> | <fct> | <chr> | <chr> | <fct> | <fct> | <fct> | <fct> | <chr> | <chr> | <fct> | <fct> | <fct> | |
| MIBC5P.ATGGTTGAGTGACACG | MIBC5P | 22882.655 | 4557 | 15 | Mye | P | MIBC5 | cDC | cDC - 0 | 10 | 10 | 12 | 15 | DC – CLEC9A+WDFY4+ | DC | DC – CLEC9A+WDFY4+ | CD141+ DC | Non-Malignant |
| MIBC5P.CGCAGGTGTTTGGGTT | MIBC5P | 5257.862 | 1614 | 15 | Mye | P | MIBC5 | cDC | cDC - 3 | 10 | 10 | 12 | 15 | DC – CLEC9A+WDFY4+ | DC | DC – CLEC9A+WDFY4+ | CD141+ DC | Non-Malignant |
[60]:
Mye_final@meta.data$treat <- "NoTreat"
Mye_final@meta.data[Mye_final@meta.data$patient == "MIBC5", "treat"] <- "Treat"
Mye_final@meta.data[Mye_final@meta.data$patient == "MIBC6", "treat"] <- "Treat"
Mye_final@meta.data[Mye_final@meta.data$patient == "MIBC8", "treat"] <- "Treat"
Mye_final@meta.data[Mye_final@meta.data$patient == "MIBC13", "treat"] <- "Treat"

Mye_final@meta.data$status_treat <- paste(Mye_final@meta.data$status2, Mye_final@meta.data$treat, sep="_")

Idents(Mye_final) <- "cell.type.sub3"
[61]:
saveRDS(Mye_final, "/annoroad/data1/bioinfo/PROJECT/big_Commercial/Cooperation/B_TET/B_TET-003/std/result/fanxuning/commander_test/THU/final_Mye_20220805.RDS")
[62]:
print(1)
[1] 1
[57]:
options(repr.plot.width=15, repr.plot.height=12)

Tside_genes <- c("PDCD1", "CTLA4", "CD28", "HAVCR2", "TNFRSF9", "BTLA", "TIGIT", "LAG3", "TNFSF14", "ICOS")
StackedVlnPlot(Mye_final, features=APCside_genes, split.by="status_treat", cols= c('#EE8084','#19BBC1'), pt.size = 0)
#ggsave("/annoroad/data1/bioinfo/PROJECT/big_Commercial/Cooperation/B_TET/B_TET-003/std/result/fanxuning/commander_test/THU/APCside_genes_in_Mye.pdf", w=15, h=12)
Error in StackedVlnPlot(Mye_final, features = APCside_genes, split.by = "status_treat", : 没有"StackedVlnPlot"这个函数
Traceback:
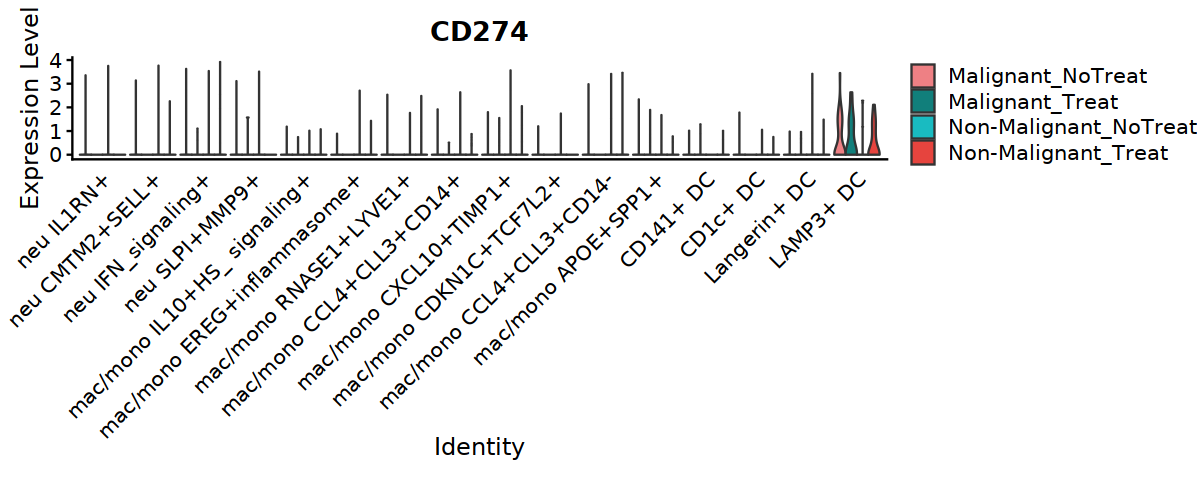
[92]:
options(repr.plot.width=10, repr.plot.height=4)


VlnPlot(Mye_final, features=c("CD274"), ,split.by="status_treat", group.by="cell.type.sub3",
            cols = c('#EE8084','#19BBC1'),
            pt.size = 0) +
        theme(axis.ticks.x=element_blank()) +
        theme(axis.text.y=element_text(angle=0,hjust=1,size=12))
[111]:
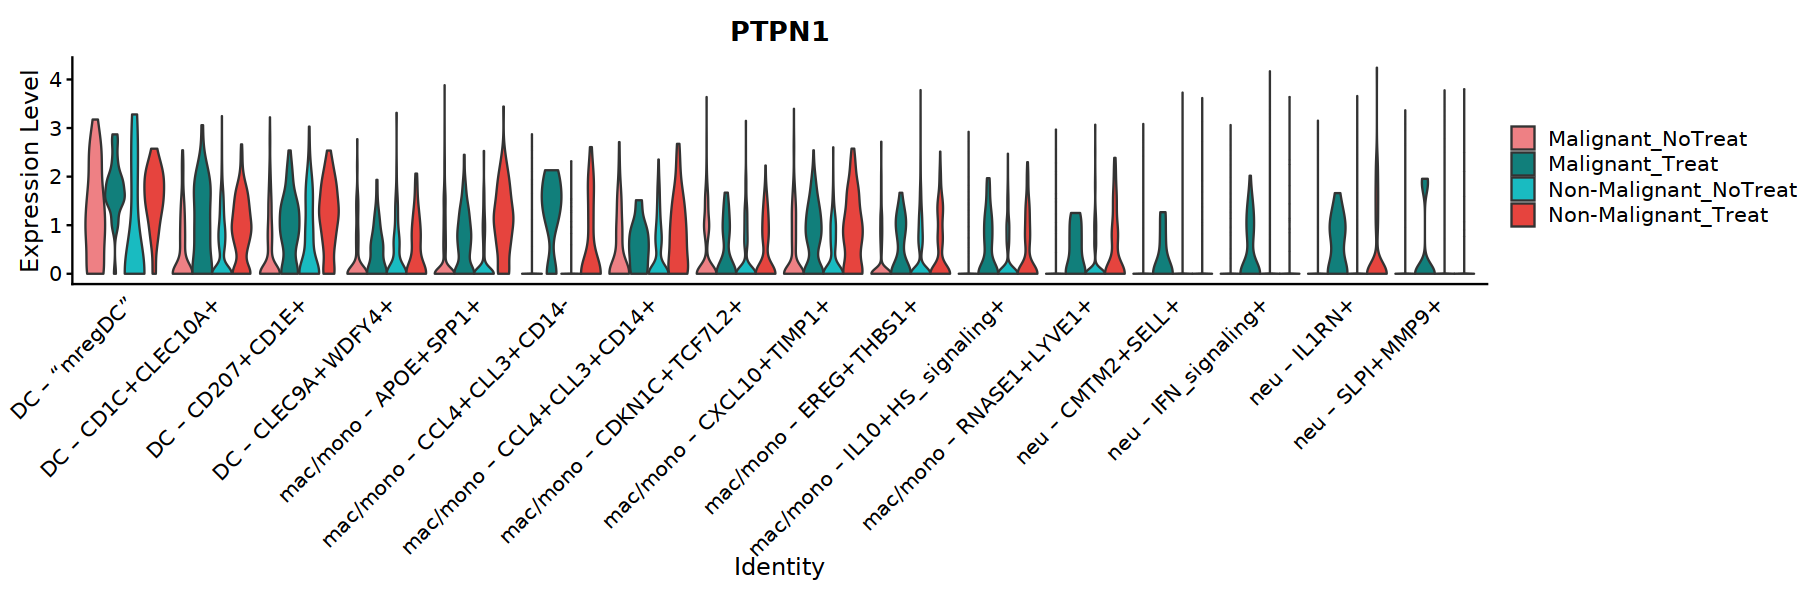
options(repr.plot.width=15, repr.plot.height=5)
VlnPlot(Mye_final, features=c("PTPN1"), ,split.by="status_treat", group.by="cell.type.sub",
            cols = c('#EE8084','#19BBC1'),
            pt.size = 0) +
        theme(axis.ticks.x=element_blank()) +
        theme(axis.text.y=element_text(angle=0,hjust=1,size=12))
[16]:
library(Seurat)
cluster.averages <- AverageExpression(object = DC, slot="count",return.seurat = F)
cluster.averages$RNA['CD86',]
- CD141+ DC
- 1.17565151350253
- CD1c+ DC
- 2.85247704140467
- Langerin+ DC
- 3.80231963933763
- LAMP3+ DC
- 3.0340060372648
- pDC
- 0.540491815599963
[13]:
cluster.averages <- AverageExpression(object = DC)
[ ]:
[ ]:
[ ]: