[ ]:
library(Seurat)
library(dplyr)
library(tidyverse)
library(viridis)
library(ggalluvial)
library("ggsci")
library("ggplot2")
library("gridExtra")
Mye and DC clusters#
[ ]:
my24_1colors <- c('#53868B','#00F5FF','#7FFFD4','#C1FFC1','#0000FF','#7B68EE',
                  '#CDCD00','#FFF68F','#CD9B1D','#8B658B','#FF6A6A','#8B3A3A',
                  '#1E90FF','#FF69B4','#8DB6CD','#CAE1FF','#EECFA1','#8B7B8B',
                  '#4F4F4F','#FF4500','#BC8F8F','#FFA500','#228B22','#8B4513')

my23colors <- c('#53868B','#00F5FF','#C1FFC1','#0000FF','#7B68EE',
                  '#CDCD00','#FFF68F','#CD9B1D','#8B658B','#FF6A6A','#8B3A3A',
                  '#1E90FF','#FF69B4','#8DB6CD','#CAE1FF','#EECFA1','#8B7B8B',
                  '#4F4F4F','#FF4500','#BC8F8F','#FFA500','#228B22','#8B4513')
[ ]:
setwd("/annoroad/data1/bioinfo/PROJECT/big_Commercial/Cooperation/B_TET/B_TET-003/std/result/fanxuning/commander_test/THU")
[ ]:
DC <- readRDS("V1_Celltype_allDC_2nd_withAnnotation.rds")
[1]:
DC@meta.data$cell.type.sub3 <- "LAMP3+ DC"
DC@meta.data[DC@meta.data$cell.type.sub2 == "DC – CD1C+CLEC10A+", "cell.type.sub3"] <- "CD1c+ DC"
DC@meta.data[DC@meta.data$cell.type.sub2 == "DC – CD207+CD1E+", "cell.type.sub3"] <- "Langerin+ DC"
DC@meta.data[DC@meta.data$cell.type.sub2 == "DC – CLEC9A+WDFY4+", "cell.type.sub3"] <- "CD141+ DC"
DC@meta.data[DC@meta.data$cell.type.sub2 == "pDC – TCF4+IL3RA+", "cell.type.sub3"] <- "pDC"

DC@meta.data$cell.type.sub3 <- factor(DC@meta.data$cell.type.sub3,
                                      levels = c("CD141+ DC", "CD1c+ DC", "Langerin+ DC", "LAMP3+ DC", "pDC"))
Error in DC@meta.data$cell.type.sub3 <- "LAMP3+ DC": 找不到对象'DC'
Traceback:
[ ]:
Mye <- readRDS("/annoroad/data1/bioinfo/PROJECT/big_Commercial/Cooperation/B_TET/B_TET-072/supplement/yaojiaying/AN202202140002/Analysis/Data/V1_Celltype_Mye_3nd_withAnnotation.rds")
[ ]:
DC@meta.data$status2 <- "Malignant"
DC@meta.data[DC@meta.data$status == "P", "status2"] <- "Non-Malignant"
DC@meta.data[DC@meta.data$status == "T", "status2"] <- "Malignant"

DC@meta.data$status2 <- factor(DC@meta.data$status2,levels = c("Malignant", "Non-Malignant"))
[ ]:
unique(Mye@meta.data$cell.type.sub2)
[ ]:
Mye@meta.data$cell.type.sub3 <- Mye@meta.data$cell.type.sub2
Mye@meta.data[rownames(DC@meta.data), "cell.type.sub3"] <- as.character(DC$cell.type.sub3)
[ ]:
Mye@meta.data$status2 <- "Malignant"
Mye@meta.data[Mye@meta.data$status == "P", "status2"] <- "Non-Malignant"
Mye@meta.data[Mye@meta.data$status == "T", "status2"] <- "Malignant"

Mye@meta.data$status2 <- factor(Mye@meta.data$status2, levels = c("Malignant", "Non-Malignant"))
[ ]:
[ ]:
[ ]:
selectCells <- Cells(Mye)[Mye$cell.type.sub2 %in% c("DC – CLEC9A+WDFY4+", "DC – CD1C+CLEC10A+", "DC – CD207+CD1E+", "DC – “mregDC”", "pDC – TCF4+IL3RA+")]
deadCells <- selectCells[selectCells %in% Cells(DC) == FALSE]
length(deadCells)
Mye@meta.data[deadCells, "cell.type.sub3"] <- "deadCells"
final_Mye <- subset(Mye, cell.type.sub3 != "deadCells")
[ ]:
final_Mye@meta.data$status2 <- "Malignant"
final_Mye@meta.data[final_Mye@meta.data$status == "P", "status2"] <- "Non-Malignant"
final_Mye@meta.data[final_Mye@meta.data$status == "T", "status2"] <- "Malignant"

final_Mye@meta.data$status2 <- factor(final_Mye@meta.data$status2, levels = c("Malignant", "Non-Malignant"))
[ ]:
options(repr.plot.width=8, repr.plot.height=5)
DimPlot(final_Mye,  group.by="cell.type.sub3", raster=TRUE, label=FALSE, pt.size=0.1)
[ ]:
[ ]:
[ ]:
[ ]:
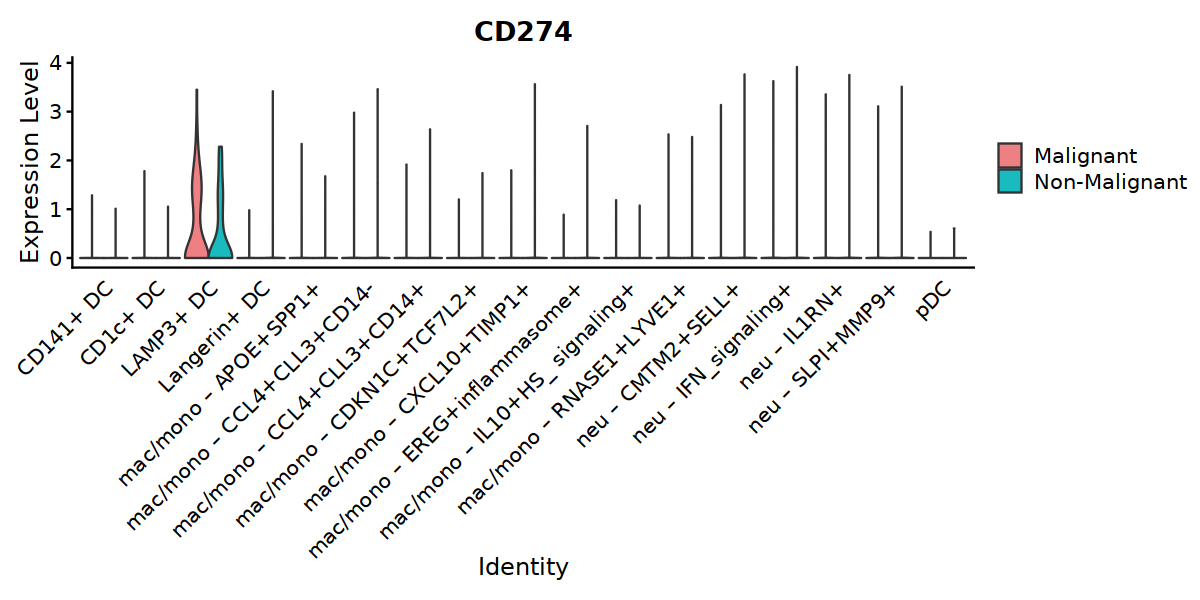
[16]:
options(repr.plot.width=10, repr.plot.height=5)

Idents(final_Mye) <- "cell.type.sub3"

VlnPlot(final_Mye, features=c("CD274"), split.by="status2", group.by="cell.type.sub3",
            cols = c('#EE8084','#19BBC1'),
            pt.size = 0) +
        theme(axis.ticks.x=element_blank()) +
        theme(axis.text.y=element_text(angle=0,hjust=1,size=12))

#ggsave("Fig5A-1-CD274-in-Mye.pdf", w=10, h=5)
The default behaviour of split.by has changed.
Separate violin plots are now plotted side-by-side.
To restore the old behaviour of a single split violin,
set split.plot = TRUE.

This message will be shown once per session.
[2]:
VlnPlot(final_Mye, features=c("CD274"), split.by="status2", group.by="cell.type.sub3",
            cols = c('#EE8084','#19BBC1'),
            pt.size = 0) +
        theme(axis.ticks.x=element_blank()) +
        theme(axis.text.y=element_text(angle=0,hjust=1,size=12))
Error in VlnPlot(final_Mye, features = c("CD274"), split.by = "status2", : 没有"VlnPlot"这个函数
Traceback:
[1]:
final_Mye
Error in eval(expr, envir, enclos): 找不到对象'final_Mye'
Traceback:
[ ]:
[17]:
plot_sank <- function(dada_per, condition, groups, count, colors){
    p <- ggplot(dada_per,
       aes_string(x = condition, stratum = groups, alluvium = groups, y=count,
           fill = groups, label = groups)) +
      scale_x_discrete(expand = c(0, 0)) +
      geom_flow(width = 1/8) + #线跟方块间空隙的宽窄
      geom_stratum(alpha = .9,width = 1/10) + #方块的透明度、宽度
      #geom_text(stat = "stratum", size = 3, color="black") +  #文字大小、颜色
      scale_fill_manual(values = colors) +

      xlab("") + ylab("") +
      theme_bw() + #去除背景色
      theme(panel.grid =element_blank()) + #去除网格线
      theme(panel.border = element_blank()) + #去除外层边框
      theme(legend.title = element_blank()) +
      theme(axis.line = element_blank(),axis.ticks = element_blank()) + #去掉坐标轴
      ggtitle("")
    return(p)
}
[18]:
options(repr.plot.width=6, repr.plot.height=7)

final_Mye_per <- round(prop.table(table(final_Mye@meta.data[,c("status2", "cell.type.sub3")]), margin=1),3)
final_Mye_per <- data.frame(final_Mye_per)
final_Mye_per$status2 <- factor(final_Mye_per$status2, levels = c("Non-Malignant", "Malignant"))

plot_sank(final_Mye_per, "status2", "cell.type.sub3","Freq", my23colors)
#ggsave("Fig2C-Mye-conditon-frequency-2.pdf",w=6,h=7)
Warning message:
“The `.dots` argument of `group_by()` is deprecated as of dplyr 1.0.0.
This warning is displayed once every 8 hours.
Call `lifecycle::last_lifecycle_warnings()` to see where this warning was generated.”

[19]:
DC_colors <- c("#FBD44A", "#8A9197", "#709AE1", "#F07344", "#D2AF81")
[20]:
options(repr.plot.width=4, repr.plot.height=4)

final_Mye_per <- round(prop.table(table(final_Mye@meta.data[,c("status2", "cell.type.sub3")]), margin=1),3)
final_Mye_per <- data.frame(final_Mye_per)
final_Mye_per$status2 <- factor(final_Mye_per$status2, levels = c("Non-Malignant", "Malignant"))
final_Mye_per <- subset(final_Mye_per, cell.type.sub3=="LAMP3+ DC")
plot_sank(final_Mye_per, "status2", "cell.type.sub3","Freq", DC_colors[4])
ggsave("Fig2C-Mye-LAMP3_DC-conditon-frequency-2.pdf",w=5,h=5)

[ ]:
[21]:
IPF <- readRDS("/annoroad/data1/bioinfo/PROJECT/big_Commercial/Cooperation/B_TET/TET_PUBLIC/zhaoyue/project/B_TET_074/IPF_dbfree.rds")
[22]:
options(repr.plot.width=6, repr.plot.height=5)
DimPlot(IPF, group.by="cell.type", label=TRUE)

[23]:
unique(IPF_Mac@meta.data$seurat_clusters)
IPF_Mac@meta.data$seurat_clusters <- factor(IPF_Mac@meta.data$seurat_clusters, levels=c(1,2,3,4,6,7,9,10,11))
Error in unique(IPF_Mac@meta.data$seurat_clusters): 找不到对象'IPF_Mac'
Traceback:

1. unique(IPF_Mac@meta.data$seurat_clusters)
[ ]:
options(repr.plot.width=15, repr.plot.height=4)

VlnPlot(IPF_Mac, features=c("Trem2"), split.by="orig.ident", group.by="seurat_clusters",
            cols = c('#FFF68F','#CD9B1D','#8B658B','#FF6A6A'),
            pt.size = 0) +
        theme(axis.ticks.x=element_blank()) +
        theme(axis.text.y=element_text(angle=0,hjust=1,size=12))
[ ]:
IPF_Mac2 <- subset(IPF, seurat_clusters %in% c( 1,3,6,10,11))

VlnPlot(IPF_Mac2, features=c("Trem2"), split.by="orig.ident", group.by="seurat_clusters",
            #cols = c('#EE8084','#19BBC1'),
            pt.size = 0) +
        theme(axis.ticks.x=element_blank()) +
        theme(axis.text.y=element_text(angle=0,hjust=1,size=12))
[24]:
Mac_without_UK <- readRDS("/annoroad/data1/bioinfo/PMO/yuanzan/project/comm/commander_test/THU/Mac_without_UK.rds")
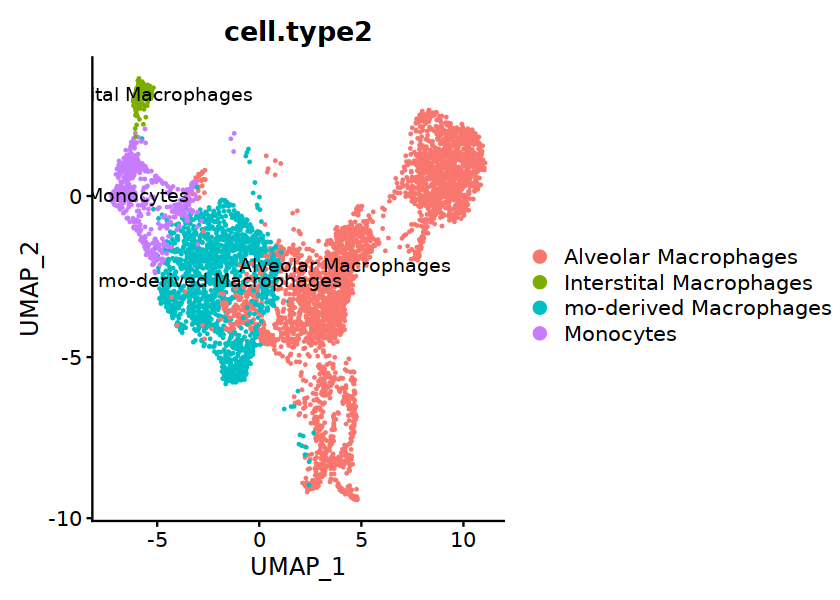
[25]:
Mac_without_UK@meta.data$cell.type2 <- "null"
Mac_without_UK@meta.data[Mac_without_UK$cell.type=="AM", "cell.type2"] <- "Alveolar Macrophages"
Mac_without_UK@meta.data[Mac_without_UK$cell.type=="IntMacs", "cell.type2"] <- "Interstital Macrophages"
Mac_without_UK@meta.data[Mac_without_UK$cell.type=="Mono", "cell.type2"] <- "Monocytes"
Mac_without_UK@meta.data[Mac_without_UK$cell.type=="MonMac", "cell.type2"] <- "mo-derived Macrophages"
[26]:
options(repr.plot.width=7, repr.plot.height=5)
Idents(Mac_without_UK) <- "cell.type2"
DimPlot(Mac_without_UK, group.by="cell.type2", label=TRUE)
[27]:
library(RColorBrewer)
cuscolos <- colorRampPalette(brewer.pal(4, "Set2"))(4)

options(repr.plot.width=10, repr.plot.height=6)
VlnPlot(Mac_without_UK, slot="data", features=c("Trem2"), split.by="sampleID", group.by="cell.type2",
            cols = cuscolos,
            pt.size = 0.1) +
        theme(axis.ticks.x=element_blank()) +
        theme(axis.text.y=element_text(angle=0,hjust=1,size=12))
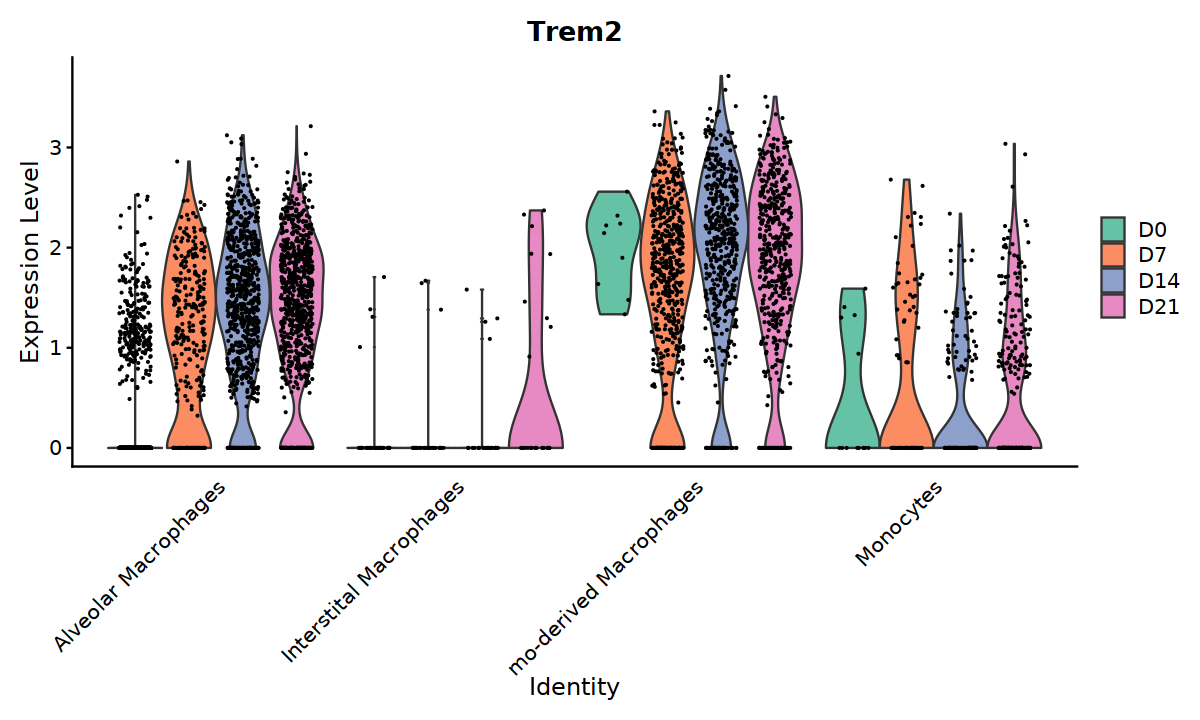
[28]:
p <- ggplot(exp_Trem2, aes(x=cell.type2, y=Trem2, fill=sampleID)) +
        geom_violin(scale='width', stat="ydensity",trim = TRUE, na.rm=TRUE, alpha=0.2, adjust=1, color=FALSE) + theme_light() +
        theme(axis.ticks.x=element_blank()) +
        theme(axis.text.x=element_text(angle=90,hjust=1,size=11)) +
        theme(axis.text.y=element_text(size=12)) +
        xlab("") + ylab("Expression Level") + labs(title = "Trem2")
        # + scale_color_manual(values=cuscolos)
p
Error in ggplot(exp_Trem2, aes(x = cell.type2, y = Trem2, fill = sampleID)): 找不到对象'exp_Trem2'
Traceback:

1. ggplot(exp_Trem2, aes(x = cell.type2, y = Trem2, fill = sampleID))
[ ]:
library(ggsci)
library(ggridges)
library(ggunchained)
library(ggthemes)

Mac_without_UK@meta.data$Trem2 <- Mac_without_UK@assays$RNA@data["Trem2",]
exp_Trem2 <- Mac_without_UK@meta.data[,c("sampleID", "cell.type2", "Trem2")]
[ ]:
[ ]:
options(repr.plot.width=6, repr.plot.height=5)

p <- ggplot(exp_Trem2, aes(color=cell.type2 , x=sampleID, y=Trem2, fill=cell.type2)) +
        geom_split_violin(scale='width', stat="ydensity",trim = TRUE, na.rm=TRUE, alpha=0.2) + theme_light() +
        theme(axis.ticks.x=element_blank()) +
        theme(axis.text.x=element_text(angle=90,hjust=1,size=11)) +
        theme(axis.text.y=element_text(size=12)) +
        xlab("") + ylab("Expression Level") + labs(title = "Trem2")
        # + scale_color_manual(values=cuscolos)
p

ggsave("/annoroad/data1/bioinfo/PMO/yuanzan/project/comm/commander_test/THU/Trem2-in-MAC.pdf",w=6,h=5)
[ ]:
options(repr.plot.width=12, repr.plot.height=5)

Mac_without_UK@meta.data$Trem2 <- Mac_without_UK@assays$RNA@data["Trem2",]
exp_Trem2 <- Mac_without_UK@meta.data[,c("sampleID", "cell.type2", "Trem2")]


p <- ggplot(exp_Trem2, aes(x=cell.type2, y=Trem2, fill=sampleID)) +
        geom_violin(scale='width', stat="ydensity", trim = TRUE, na.rm=FALSE, alpha=0.2, adjust=1, color=FALSE) + theme_light() +
        theme(axis.ticks.x=element_blank()) +
        theme(axis.text.x=element_text(angle=90,hjust=1,size=11)) +
        theme(axis.text.y=element_text(size=12)) +
        xlab("") + ylab("Expression Level") + labs(title = "Trem2")
        # + scale_color_manual(values=cuscolos)
p

#ggsave("/annoroad/data1/bioinfo/PMO/yuanzan/project/comm/commander_test/THU/Trem2-in-MAC2.pdf",w=6,h=5)
[ ]:
IPF@meta.data$Trem2 <- IPF@assays$RNA@data["Trem2",]
IPF_exp_Trem2 <- IPF@meta.data[,c("orig.ident", "cell.type", "Trem2")]
[ ]:
options(repr.plot.width=10, repr.plot.height=5)

p <- ggplot(IPF_exp_Trem2, aes( x=orig.ident, y=Trem2, fill=cell.type)) +
        geom_violin(scale='area', stat="ydensity",trim = TRUE, na.rm=TRUE, alpha=0.2, color=FALSE ) + theme_light() +
        theme(axis.ticks.x=element_blank()) +
        theme(axis.text.x=element_text(angle=90,hjust=1,size=11)) +
        theme(axis.text.y=element_text(size=12)) +
        xlab("") + ylab("Expression Level") + labs(title = "Trem2") +
        # + scale_color_manual(values=cuscolos)
        theme(panel.background=element_rect(fill='transparent', color='gray'),
                legend.key=element_rect(fill='transparent', color='transparent'))
p

#ggsave("/annoroad/data1/bioinfo/PMO/yuanzan/project/comm/commander_test/THU/Trem2-in-IPF.pdf",w=6,h=5)
[ ]:
options(repr.plot.width=6, repr.plot.height=5)

p <- ggplot(IPF_exp_Trem2, aes(color=orig.ident , x=cell.type, y=Trem2, fill=orig.ident)) +
        geom_split_violin(scale='width', stat="ydensity",trim = TRUE, na.rm=TRUE, alpha=0.2) + theme_light() +
        theme(axis.ticks.x=element_blank()) +
        theme(axis.text.x=element_text(angle=90,hjust=1,size=11)) +
        theme(axis.text.y=element_text(size=12)) +
        xlab("") + ylab("Expression Level") + labs(title = "Trem2")
        # + scale_color_manual(values=cuscolos)
p

ggsave("/annoroad/data1/bioinfo/PMO/yuanzan/project/comm/commander_test/THU/Trem2-in-IPF2.pdf",w=6,h=5)
[ ]:
[ ]:
[ ]:
options(repr.plot.width=7, repr.plot.height=5)
Idents(Mac_without_UK) <- "cell.type2"
DimPlot(Mac_without_UK, group.by="cell.type", label=TRUE)
[ ]:
options(repr.plot.width=6, repr.plot.height=5)
IPF@meta.data$cell.type <- as.character(IPF@meta.data$cell.type)

DimPlot(IPF, group.by="cell.type", label=TRUE)
[ ]:
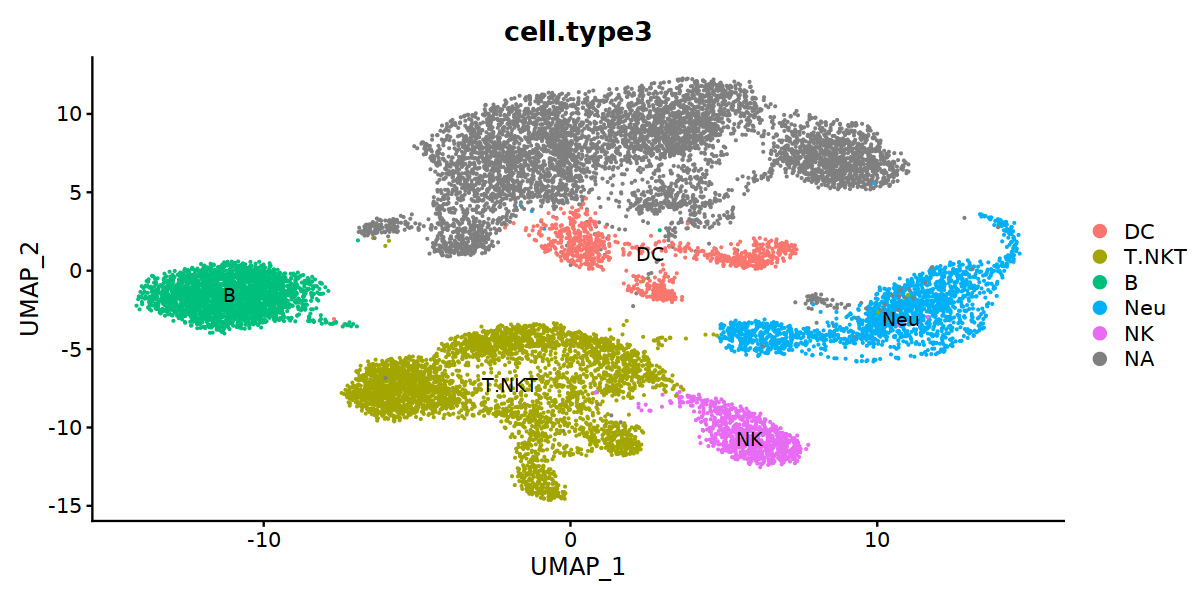
[33]:
IPF$cell.type3 <- IPF$cell.type

AM <- colnames(subset(Mac_without_UK, cell.type2 == "Alveolar Macrophages"))
IM <- colnames(subset(Mac_without_UK, cell.type2 == "Interstital Macrophages"))
MONO <- colnames(subset(Mac_without_UK, cell.type2 == "Monocytes"))
mom <- colnames(subset(Mac_without_UK, cell.type2 == "mo-derived Macrophages"))

IPF@meta.data[AM, "cell.type3"] <- "Alveolar Macrophages"
IPF@meta.data[IM, "cell.type3"] <- "Interstital Macrophages"
IPF@meta.data[MONO, "cell.type3"] <- "Monocytes"
IPF@meta.data[mom, "cell.type3"] <- "mo-derived Macrophages"

IPF@meta.data[colnames(subset(IPF, cell.type3== "Mac")), "cell.type3"] <- "Mac_with_UK"
Warning message in `[<-.factor`(`*tmp*`, iseq, value = c("Alveolar Macrophages", :
“invalid factor level, NA generated”
Warning message in `[<-.factor`(`*tmp*`, iseq, value = c("Interstital Macrophages", :
“invalid factor level, NA generated”
Warning message in `[<-.factor`(`*tmp*`, iseq, value = c("Monocytes", "Monocytes", :
“invalid factor level, NA generated”
Warning message in `[<-.factor`(`*tmp*`, iseq, value = c("mo-derived Macrophages", :
“invalid factor level, NA generated”
Warning message in `[<-.factor`(`*tmp*`, iseq, value = c("Mac_with_UK", "Mac_with_UK", :
“invalid factor level, NA generated”
[34]:
options(repr.plot.width=10, repr.plot.height=5)
DimPlot(IPF, group.by="cell.type3", label=TRUE)
[ ]:
IPF$stim <- as.character(IPF$orig.ident)
D012IPF <- subset(IPF, stim %in% c("D0", "D21"))
D012IPF@meta.data[D012IPF$stim=="D0", "stim"] <- "Normal"
D012IPF@meta.data[D012IPF$stim=="D21", "stim"] <- "IPF"
D012IPF@meta.data$cell.type3 <- factor(D012IPF@meta.data$cell.type3, levels=c("Alveolar Macrophages", "Interstital Macrophages", "Monocytes", "mo-derived Macrophages", "Mac_with_UK", "DC", "Neu", "NK", "T.NKT", "B"))
[ ]:
[ ]:
[ ]:
VlnPlot(D012IPF, features=c("Trem2"), split.by="stim", group.by="cell.type3", adjust=1,
            #cols = c('#EE8084','#19BBC1'),
            #cols=c(FALSE,FALSE),
            pt.size = 0) +
        theme(axis.ticks.x=element_blank()) +
        theme(axis.text.x=element_text(angle=60,hjust=1,size=12))

#ggsave("Trem2_Normal_IPF.pdf",w=10,h=5)
[ ]:
D012IPF@meta.data$Trem2 <- D012IPF@assays$RNA@data["Trem2",]
D012IPF_exp_Trem2 <- D012IPF@meta.data[,c("stim", "cell.type3", "Trem2")]
[ ]:
#D012IPF_exp_Trem2[D012IPF_exp_Trem2$Trem2 == 0, "Trem2"] <- NA
[ ]:
options(repr.plot.width=12, repr.plot.height=6)

line_data <- data.frame(x=c(0.4), xend=c(1.6), y=c(0), yend=c(0))


p <- ggplot(D012IPF_exp_Trem2, aes(x=cell.type3, y=Trem2, fill=stim)) +
        geom_violin(scale='width', width=0.6, stat="ydensity", trim = TRUE, na.rm=FALSE, alpha=1, adjust=1, color=FALSE) + theme_classic() +
        theme(axis.ticks.x=element_blank()) +
        theme(axis.text.x=element_text(angle=70,hjust=1,size=14)) +
        theme(axis.text.y=element_text(size=12)) +
        xlab("") + ylab("Expression Level") + labs(title = "Trem2") +
        theme(axis.line.x=element_blank()) + theme(legend.title = element_blank(), legend.text = element_text(size=12))

        # + scale_color_manual(values=cuscolos)
#p + geom_segment(x=c(0.7, 1.7, 2.7, 3.7, 4.7, 5.7, 6.7 , 7.7, 8.7, 9.7),
#                 xend=c(1.3, 2.3, 3.3, 4.3, 5.3, 6.3, 7.3, 8.3, 9.3, 10.3),
#                 y=c(0,0,0,0,0,0,0,0,0,0), yend=c(0,0,0,0,0,0,0,0,0,0))
p <- p + geom_segment(x=c(0.7), xend=c(1.3), y=c(-0.1), yend=c(-0.1))
p <- p + geom_segment(x=c(1.7), xend=c(2.3), y=c(-0.1), yend=c(-0.1))
p <- p + geom_segment(x=c(2.7), xend=c(3.3), y=c(-0.1), yend=c(-0.1))
p <- p + geom_segment(x=c(3.7), xend=c(4.3), y=c(-0.1), yend=c(-0.1))
p <- p + geom_segment(x=c(4.7), xend=c(5.3), y=c(-0.1), yend=c(-0.1))
p <- p + geom_segment(x=c(5.7), xend=c(6.3), y=c(-0.1), yend=c(-0.1))
p <- p + geom_segment(x=c(6.7), xend=c(7.3), y=c(-0.1), yend=c(-0.1))
p <- p + geom_segment(x=c(7.7), xend=c(8.3), y=c(-0.1), yend=c(-0.1))
p <- p + geom_segment(x=c(8.7), xend=c(9.3), y=c(-0.1), yend=c(-0.1))
p <- p + geom_segment(x=c(9.7), xend=c(10.3), y=c(-0.1), yend=c(-0.1))

#p + stat_compare_means(aes(group = stim), label="p.signif")
p + stat_compare_means(aes(group = stim), label="p.format")

ggsave("Trem2_Normal_IPF_2.pdf",w=12,h=6)
[ ]:
options(repr.plot.width=6, repr.plot.height=7)

final_Mye_per <- round(prop.table(table(D012IPF@meta.data[,c("stim", "cell.type3")]), margin=1),3)
final_Mye_per <- data.frame(final_Mye_per)
final_Mye_per$stim <- factor(final_Mye_per$stim, levels = c("Normal","IPF"))

plot_sank(final_Mye_per, "stim", "cell.type3","Freq", my23colors)
[ ]:
options(repr.plot.width=10, repr.plot.height=6)

DimPlot(D012IPF, group.by="cell.type3", label=TRUE, cols=my23colors[9:23])
[ ]:
Idents(D012IPF) <- "cell.type3"
Mac_with_UK_marker <- FindMarkers(object=D012IPF, ident.1="Mac_with_UK",
                         assay = 'RNA', slot = 'counts', logfc.threshold=0.1,min.pct = 0.2)
[ ]:
[29]:
library(dplyr)
topRGNs <- Mac_with_UK_marker %>% top_n(n = 10, wt = avg_log2FC)
Error in filter(x, top_n_rank({: 找不到对象'Mac_with_UK_marker'
Traceback:

1. Mac_with_UK_marker %>% top_n(n = 10, wt = avg_log2FC)
2. top_n(., n = 10, wt = avg_log2FC)
3. filter(x, top_n_rank({
 .     {
 .         n
 .     }
 . }, !!wt))
[30]:
rownames(topRGNs)
Error in rownames(topRGNs): 找不到对象'topRGNs'
Traceback:

1. rownames(topRGNs)
[31]:
VlnPlot(D012IPF, features=c(rownames(topRGNs), "Trem2"), split.by="stim", group.by="cell.type3", adjust=1,
            #cols = c('#EE8084','#19BBC1'),
            #cols=c(FALSE,FALSE),
        stack=TRUE,
            pt.size = 0) +
        theme(axis.ticks.x=element_blank()) +
        theme(axis.text.x=element_text(angle=60,hjust=1,size=12))
Error in DefaultAssay(object = object): 找不到对象'D012IPF'
Traceback:

1. VlnPlot(D012IPF, features = c(rownames(topRGNs), "Trem2"), split.by = "stim",
 .     group.by = "cell.type3", adjust = 1, stack = TRUE, pt.size = 0)
2. ExIPlot(object = object, type = ifelse(test = split.plot, yes = "splitViolin",
 .     no = "violin"), features = features, idents = idents, ncol = ncol,
 .     sort = sort, assay = assay, y.max = y.max, same.y.lims = same.y.lims,
 .     adjust = adjust, pt.size = pt.size, cols = cols, group.by = group.by,
 .     split.by = split.by, log = log, slot = slot, stack = stack,
 .     combine = combine, fill.by = fill.by, flip = flip, raster = raster)
3. assay %||% DefaultAssay(object = object)
4. DefaultAssay(object = object)
[32]:
VlnPlot(D012IPF, features=c("Trem2"), split.by="stim", group.by="cell.type3", adjust=1,
            #cols = c('#EE8084','#19BBC1'),
            #cols=c(FALSE,FALSE),
            pt.size = 0) +
        theme(axis.ticks.x=element_blank()) +
        theme(axis.text.x=element_text(angle=60,hjust=1,size=12))
Error in DefaultAssay(object = object): 找不到对象'D012IPF'
Traceback:

1. VlnPlot(D012IPF, features = c("Trem2"), split.by = "stim", group.by = "cell.type3",
 .     adjust = 1, pt.size = 0)
2. ExIPlot(object = object, type = ifelse(test = split.plot, yes = "splitViolin",
 .     no = "violin"), features = features, idents = idents, ncol = ncol,
 .     sort = sort, assay = assay, y.max = y.max, same.y.lims = same.y.lims,
 .     adjust = adjust, pt.size = pt.size, cols = cols, group.by = group.by,
 .     split.by = split.by, log = log, slot = slot, stack = stack,
 .     combine = combine, fill.by = fill.by, flip = flip, raster = raster)
3. assay %||% DefaultAssay(object = object)
4. DefaultAssay(object = object)
Fig6C#
[ ]:
options(repr.plot.width=9, repr.plot.height=5)

DimPlot(Mye, group.by="cell.type.sub3", cols=my23colors)
[ ]:
Fig6cFeatures <- c('CD274','PDCD1LG2','CD276','LGALS9',
                   'VSIR','TNFRSF14','CEACAM1','PVR',
                   'FGL1','VSIG4','SIGLEC10')

options(repr.plot.width=9, repr.plot.height=6)

DotPlot(Mye, features=Fig6cFeatures, group.by="cell.type.sub3", cols = c("#F5F5F5", "red")) +
    theme(axis.text.x=element_text(angle=45,hjust=1,size=12))

#ggsave("Fig6A_dotplot.pdf",w=9,h=7)
[ ]:
options(repr.plot.width=9, repr.plot.height=8)

VlnPlot(Mye,  pt.size=0, stack=TRUE, features=Fig6cFeatures, split.by="status2",group.by="cell.type.sub3") +
    theme(axis.text.x=element_text(angle=45,hjust=1,size=12)) + ylab("")

#ggsave("Fig6A_VlnPlot.pdf",w=9,h=6)
[ ]:
[ ]:
[ ]:
[ ]:
[ ]: