[1]:
library(Seurat)
library(dplyr)
library(tidyverse)
library(viridis)
library(ggalluvial)
library("ggsci")
library("ggplot2")
library("gridExtra")
#library(MySeuratWrappers)
Attaching SeuratObject


Attaching package: ‘dplyr’


The following objects are masked from ‘package:stats’:

    filter, lag


The following objects are masked from ‘package:base’:

    intersect, setdiff, setequal, union


Registered S3 method overwritten by 'cli':
  method     from
  print.boxx spatstat.geom

── Attaching packages ─────────────────────────────────────── tidyverse 1.3.1 ──

✔ ggplot2 3.3.5     ✔ purrr   0.3.4
✔ tibble  3.1.6     ✔ stringr 1.4.0
✔ tidyr   1.1.4     ✔ forcats 0.5.1
✔ readr   2.1.1

── Conflicts ────────────────────────────────────────── tidyverse_conflicts() ──
✖ dplyr::filter() masks stats::filter()
✖ dplyr::lag()    masks stats::lag()

Loading required package: viridisLite


Attaching package: ‘gridExtra’


The following object is masked from ‘package:dplyr’:

    combine
Immune checkpoint gene expression#
[2]:
my24_1colors <- c('#53868B','#00F5FF','#7FFFD4','#C1FFC1','#0000FF','#7B68EE',
                  '#CDCD00','#FFF68F','#CD9B1D','#8B658B','#FF6A6A','#8B3A3A',
                  '#1E90FF','#FF69B4','#8DB6CD','#CAE1FF','#EECFA1','#8B7B8B',
                  '#4F4F4F','#FF4500','#BC8F8F','#FFA500','#228B22','#8B4513')

my23colors <- c('#53868B','#00F5FF','#C1FFC1','#0000FF','#7B68EE',
                  '#CDCD00','#FFF68F','#CD9B1D','#8B658B','#FF6A6A','#8B3A3A',
                  '#1E90FF','#FF69B4','#8DB6CD','#CAE1FF','#EECFA1','#8B7B8B',
                  '#4F4F4F','#FF4500','#BC8F8F','#FFA500','#228B22','#8B4513')
[3]:
setwd("/annoroad/data1/bioinfo/PROJECT/big_Commercial/Cooperation/B_TET/B_TET-003/std/result/fanxuning/commander_test/THU")
[4]:
Tcell <- readRDS("T_clean_5thAnnotation.rds")
[25]:
head(Tcell@meta.data, 2)
| orig.ident | nCount_RNA | nFeature_RNA | seurat_clusters | cell.type | db.score | mt.percentage | S.Score | G2M.Score | Phase | ⋯ | patient.P | RNA_snn_res.1.5 | orig.clusters | RNA_snn_res.1 | RNA_snn_res.1.2 | RNA_snn_res.1.1 | RNA_snn_res.1.15 | RNA_snn_res.1.25 | anno.by.cluster | cell.type.sub | |
|---|---|---|---|---|---|---|---|---|---|---|---|---|---|---|---|---|---|---|---|---|---|
| <fct> | <dbl> | <int> | <fct> | <fct> | <dbl> | <dbl> | <dbl> | <dbl> | <fct> | ⋯ | <chr> | <fct> | <fct> | <fct> | <fct> | <fct> | <fct> | <fct> | <fct> | <fct> | |
| MIBC5P.AAACCCAAGAGAAGGT | MIBC5P | 4394.585 | 1674 | 6 | T | 0.03571429 | 0.08269632 | 0.01501669 | -0.07550963 | S | ⋯ | MIBC5P | 8 | 7 | 9 | 9 | 7 | 8 | 6 | gdT-antitumor | gdT-antitumor |
| MIBC5P.AAACCCATCAGACTGT | MIBC5P | 4446.459 | 1635 | 4 | T | 0.01785714 | 0.02878687 | 0.16037660 | 0.01176989 | S | ⋯ | MIBC5P | 4 | 4 | 4 | 4 | 1 | 5 | 4 | CD4-Treg(naïve) | CD4-Treg(naïve) |
[5]:
unique(Tcell@meta.data$anno.by.cluster)
unique(Tcell@meta.data$cell.type.sub)
- gdT-antitumor
- CD4-Treg(naïve)
- CD8-TEM
- naïve
- CD4-Th17-1
- CD8-TRM-1
- CD4-Th1-like
- CD4-Th17-2
- CD8-UK
- naïve-RPL
- CD4-Treg(Th17)
- CD8-TEM-CX3CR1
- CD8-IFNsignaling
- CD8-Exhausted
- CD8-CT-1
- CD8-CT-2
Levels:
- 'naïve'
- 'naïve-RPL'
- 'CD4-Th1-like'
- 'CD4-Th17-1'
- 'CD4-Th17-2'
- 'CD4-Treg(naïve)'
- 'CD4-Treg(Th17)'
- 'CD8-TRM-1'
- 'CD8-TRM-2'
- 'CD8-TEM'
- 'CD8-TEM-CX3CR1'
- 'CD8-CT-1'
- 'CD8-CT-2'
- 'CD8-IFNsignaling'
- 'CD8-Exhausted'
- 'CD8-UK'
- 'gdT-antitumor'
- gdT-antitumor
- CD4-Treg(naïve)
- CD8-TEM
- naïve
- CD4-Th17-1
- CD8-TRM-1
- CD4-Th1-like
- CD4-Th17-2
- CD8-UK
- naïve-RPL
- CD4-Treg(Th17)
- CD8_TEMRA
- CD8-IFNsignaling
- CD8-IEL_like
- CD8-CT-1
- CD8-CT-2
Levels:
- 'naïve'
- 'naïve-RPL'
- 'CD4-Th1-like'
- 'CD4-Th17-1'
- 'CD4-Th17-2'
- 'CD4-Treg(naïve)'
- 'CD4-Treg(Th17)'
- 'CD8-TRM-1'
- 'CD8-TEM'
- 'CD8_TEMRA'
- 'CD8-CT-1'
- 'CD8-CT-2'
- 'CD8-IFNsignaling'
- 'CD8-IEL_like'
- 'CD8-UK'
- 'gdT-antitumor'
[6]:
Tcell@meta.data$status2 <- "Malignant"
Tcell@meta.data[Tcell@meta.data$status == "P", "status2"] <- "Non-Malignant"
Tcell@meta.data[Tcell@meta.data$status == "T", "status2"] <- "Malignant"

Tcell@meta.data$status2 <- factor(Tcell@meta.data$status2,levels = c("Malignant", "Non-Malignant"))
#
[ ]:
[11]:
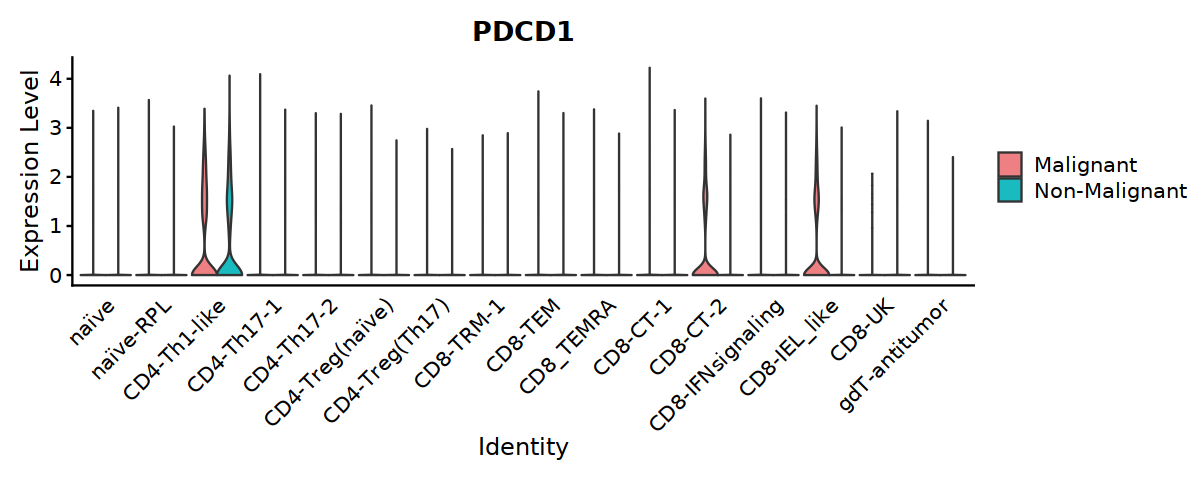
options(repr.plot.width=10, repr.plot.height=4)

Idents(Tcell) <- "cell.type.sub"

VlnPlot(Tcell, features=c("PDCD1"), ,split.by="status2", group.by="cell.type.sub",
            cols = c('#EE8084','#19BBC1'),
            pt.size = 0) +
        theme(axis.ticks.x=element_blank()) +
        theme(axis.text.y=element_text(angle=0,hjust=1,size=12))

ggsave("Fig5A-2-PDCD1-in-Tcell.pdf", w=10, h=4)
[137]:
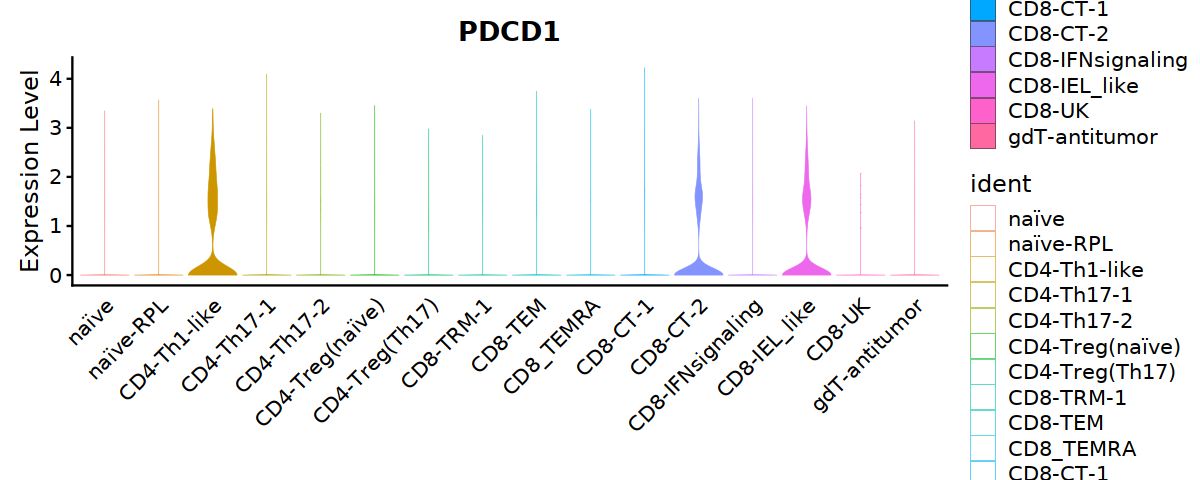
subTcell_T <- subset(Tcell, status == "T")
[79]:
VlnPlot(subTcell_T, features="PDCD1",
            direction="vertical",x.lab="", stack=FALSE,
            pt.size = 0) +
        theme(axis.ticks.x=element_blank()) +
        theme(axis.text.y=element_text(angle=0,hjust=1,size=12))
[81]:
subTcell_P <- subset(Tcell, status == "P")
VlnPlot(subTcell_P, features="PDCD1",
            direction="vertical",x.lab="", stack=FALSE,
            pt.size = 0) +
        theme(axis.ticks.x=element_blank()) +
        theme(axis.text.y=element_text(angle=0,hjust=1,size=12))

[123]:
plot_sank <- function(dada_per, condition, groups, count, colors){
    p <- ggplot(dada_per,
       aes_string(x = condition, stratum = groups, alluvium = groups, y=count,
           fill = groups, label = groups)) +
      scale_x_discrete(expand = c(0, 0)) +
      geom_flow(width = 1/8) + #线跟方块间空隙的宽窄
      geom_stratum(alpha = .9,width = 1/10) + #方块的透明度、宽度
      #geom_text(stat = "stratum", size = 3, color="black") +  #文字大小、颜色
      scale_fill_manual(values = colors) +

      xlab("") + ylab("") +
      theme_bw() + #去除背景色
      theme(panel.grid =element_blank()) + #去除网格线
      theme(panel.border = element_blank()) + #去除外层边框
      theme(legend.title = element_blank()) +
      theme(axis.line = element_blank(),axis.ticks = element_blank()) + #去掉坐标轴
      ggtitle("")
    return(p)
}
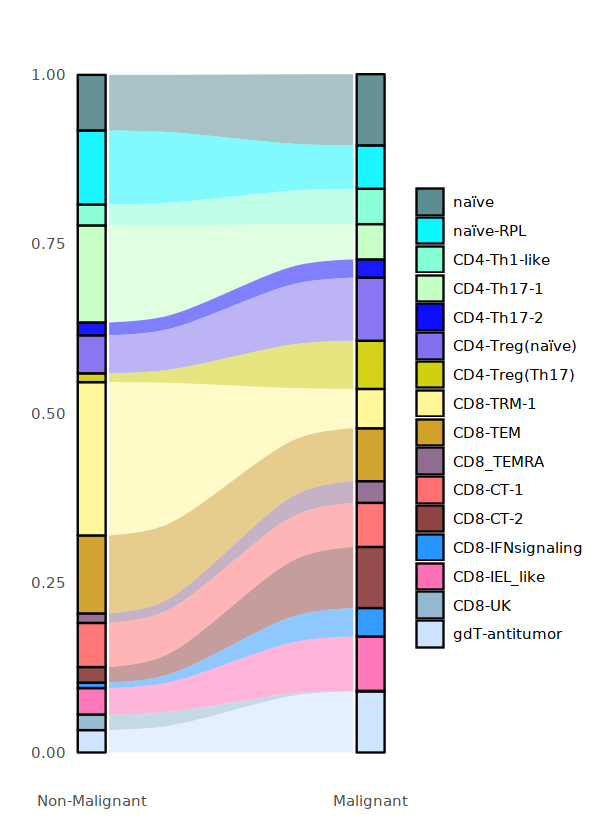
[126]:
options(repr.plot.width=5, repr.plot.height=7)


Tcell_per <- data.frame(round(prop.table(table(Tcell@meta.data[,c("status2", "cell.type.sub")]), margin=1),3))

Tcell_per$status2 <- factor(Tcell_per$status2,levels = c("Non-Malignant", "Malignant"))

plot_sank(Tcell_per, "status2", "cell.type.sub", "Freq", my24_1colors)

ggsave("Fig-Tcell-conditon-frequency.pdf",w=5,h=7)
[148]:
library(ggunchained)
library(ggthemes)
[167]:
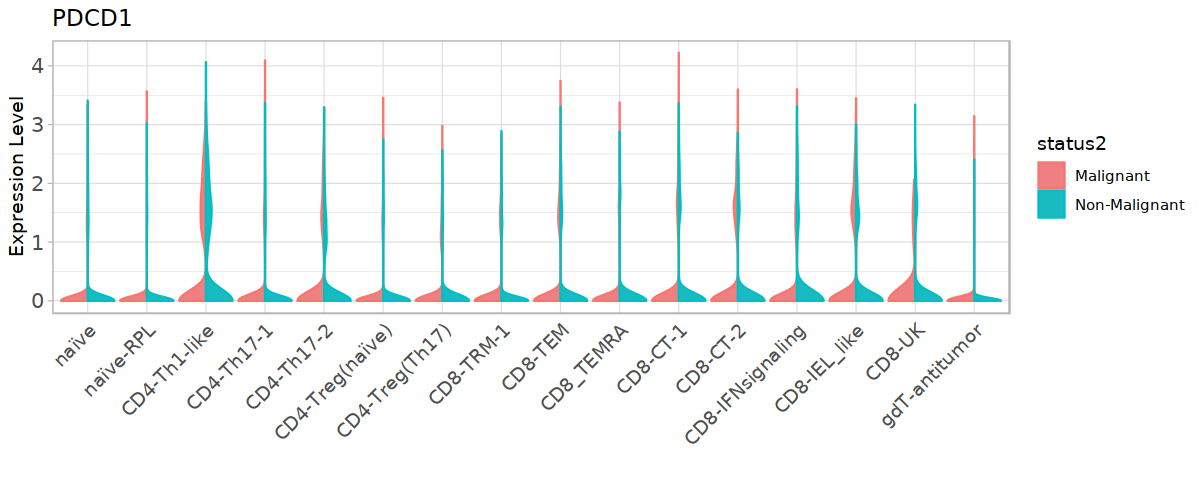
T_PDCD1_exp <- Tcell@meta.data
T_PDCD1_exp$PDCD1 <- Tcell@assays$RNA@data["PDCD1",]

T_PDCD1_exp[T_PDCD1_exp$PDCD1 < 0.5, "PDCD1"] <- 0
[168]:
options(repr.plot.width=10, repr.plot.height=4)

p <- ggplot(T_PDCD1_exp, aes(color = status2, x=cell.type.sub, y=PDCD1, fill=status2)) +
        geom_split_violin(scale='width', stat="ydensity",trim = TRUE, na.rm=TRUE) + theme_light() +
        theme(axis.ticks.x=element_blank()) +
        theme(axis.text.x=element_text(angle=45,hjust=1,size=11)) +
        theme(axis.text.y=element_text(size=12)) +
        xlab("") + ylab("Expression Level") + labs(title = "PDCD1") +
        scale_fill_manual(values=c('#EE8084','#19BBC1'))
p
[164]:
log2(0.1)
-3.32192809488736
[ ]:
[ ]:
[ ]: